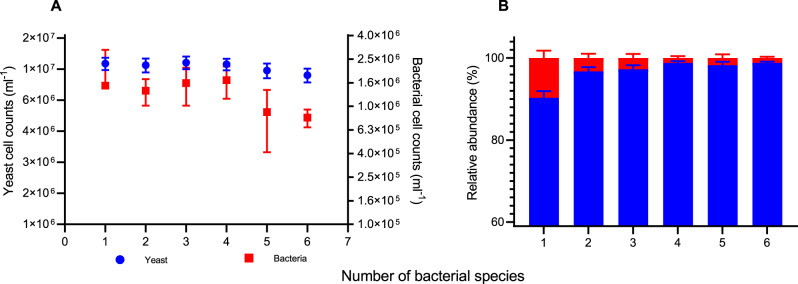
Fig. 2. The community structure of yeast and bacteria co-cultivations.
A Final cell counts of yeast (blue) and bacteria (red) from different community structures. The final yeast cell counts dropped from 1.1 × 10⁷ ± 1 × 10⁶ to ca. 9.1 × 10⁶ ± 9.3 × 10⁵ cells mL−1 as the number of bacterial species in the community increased (one-way ANOVA, p < 0.0001). The final bacterial cell counts dropped from 1.5 × 10⁷ ± 1.5 × 10⁶ to ca. 8 × 10⁵ ± 1.4 × 10⁵ cells mL−1 (one-way ANOVA, p = 0.0002). Symbols and error bars represent the mean ± standard deviation. B The relative abundance of yeast and bacterial populations in different community structures. The relative abundance of the yeast population (blue bar) increased from 90.3 ± 1.6% in pairwise cultivations to 98.8 ± 0.3% in the presence of all six different bacterial species (one-way ANOVA, p < 0.0001). The bacterial relative abundance (red bar) decreased from 9.7 ± 1.8% initially in pairwise cultivations to 1.2 ± 0.3% in the most complex community tested, which contained yeast and six different bacterial species (one-way ANOVA, p < 0.0001). Columns and error bars represent the mean ± standard deviation. For all the results presented in the figure, n = 3 independent experiments. Source data are provided as a Source Data file.

