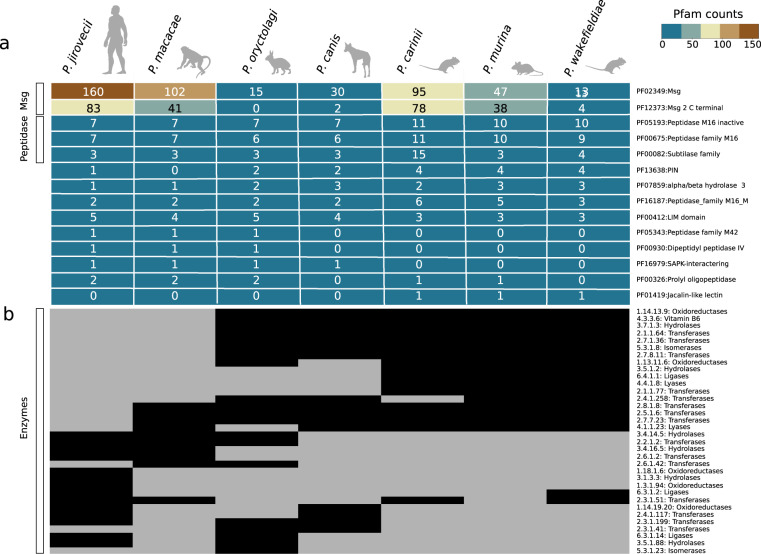
Fig. 3. Distribution of protein families among Pneumocystis species.
a Heatmap of Pfam protein domains with significant differences (Wilcoxon signed-rank test, p < 0.05) are included if the domain appears at least once in the following comparisons: primate Pneumocystis (P. jirovecii and P. macacae) versus other Pneumocystis, clade P1 (P. jirovecii, P. macacae, P. oryctolagi, and P. canis Ck1) versus clade P2 (P. carinii, P. murina, and P. wakefieldiae), primate Pneumocystis versus clade P2. The number of proteins containing each domain is indicated within each cell for each species. The heatmap is colored according to a score, as indicated by the key at the upper right corner. b Heatmap of distribution of enzymes (represented by Enzyme Commission numbers and their KEGG functional categories), with their presence and absence indicated by black and grey colored cells, respectively. Animal icons were obtained from http://phylopic.org under creative commons licenses https://creativecommons.org/licenses/by/3.0/: mouse (Anthony Caravaggi; license CC BY-NC-SA 3.0); dog (Sam Fraser-Smith and vectorized by T. Michael Keesey; license CC BY 3.0), rabbit (by Anthony Caravaggi; license CC BY-NC-SA 3.0), and rat (by Rebecca Groom; license CC BY-NC-SA 3.0). Icons original black color background were modified to light gray.

