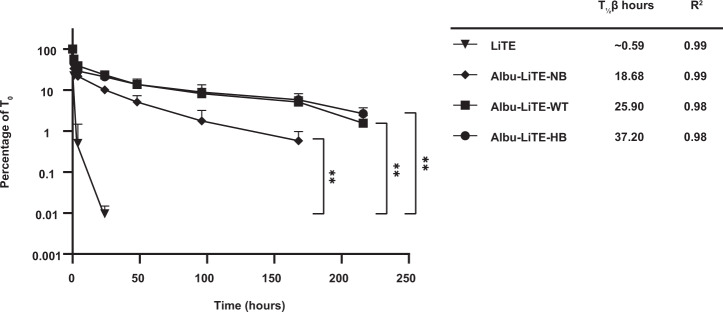
Fig. 3. Pharmacokinetic analysis of LiTE and Albu-LiTE constructs in the AlbuMus model.
Protein was i.v. injected in 4 groups of mice (N = 7 per group) and blood samples were drawn at 8 time points. Full size construct was detected in serum by ELISA. The β half-life and the R2 of the fit to the curve for each construct are listed for LiTE (triangle), Albu-LiTE-NB (diamond), Albu-LiTE-WT (square) and Albu-LiTE-HB (circle). Data was analysed with Graphpad prism v.8 using two-phase decay for calculating the molecular half-life (T½ β) and statistical differences between the constructs, detected in serum over time using a two-way ANOVA with multiple comparisons and Tukey’s post hoc correction. **p < 0.01. Error bars represent standard deviations.

