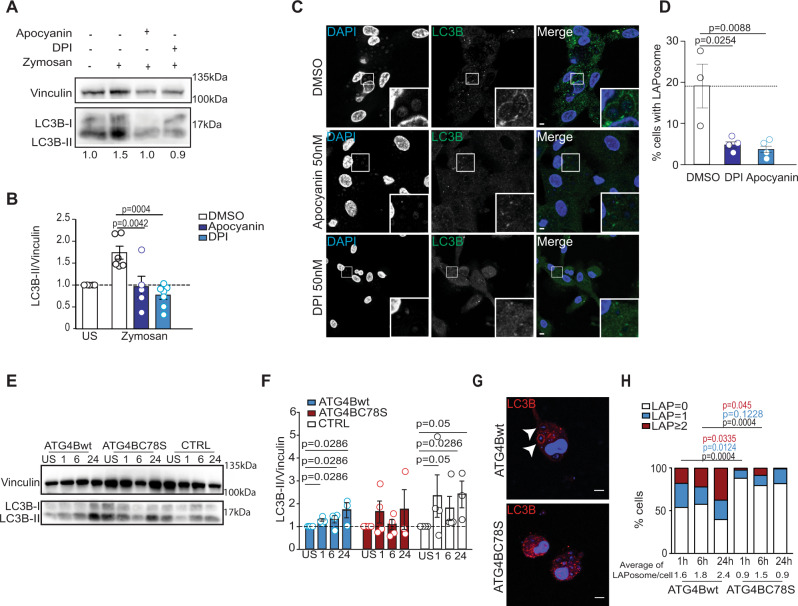
Fig. 3. Regulation of ATG4B-delipidation activity by ROS is involved in LAPosome stabilization.
A Macrophages pretreated with NOX inhibitors were stimulated with zymosan for 6 h and then lysed. Cell lysates were subjected to SDS-PAGE gel electrophoresis and immunoblotted for LC3B and the loading control vinculin. One representative experiment of three is shown and US represents unstimulated conditions. B Bar graph shows the level of LC3B-II protein expression normalized to vinculin. All conditions are normalized to the DMSO unstimulated condition, which is set to 1. Bars represent the mean ± SD: DMSO (n = 6), apocynin (n = 5), and DPI (n = 7) independent experiments, and each symbol represents a single experiment, ordinary one-way ANOVA. C Macrophages were pretreated with NOX inhibitors (apocynin 50 nM and DPI 50 nM) and stimulated for 6 h with zymosan, fixed and stained for LC3B (green). Representative images from three independent experiments are shown, scale bar is 5 µm, and inserts are 5× zoomed from white-framed regions in the original images. D Bar graph displays the percentage of cells with LAPosomes in each condition. Mean of three independent experiments and each symbol represents a single experiment. Unpaired t test two-tailed. E, F Macrophages transduced with lentiviruses encoding Flag, Flag-ATG4Bwt, or Flag-ATG4BC78S were stimulated with zymosan for 1–24 h, lysed, and LC3B protein levels were assessed by western blot. Image from one representative of three independent experiments. Bar graph shows the level of LC3B-II expression normalized to vinculin. All conditions are normalized to the respective unstimulated conditions (US), which are set to 1, and bars represent mean ± SD of three independent experiments, and each symbol represents a single experiment. Mann–Whitney test, two-tailed. G Macrophages transduced with lentiviruses encoding Flag-ATG4Bwt or Flag-ATG4BC78S were stimulated with zymosan for 6 h, fixed and stained for LC3B (red). White arrows indicate the recruitment of LC3B to zymosan-containing phagosomes. Representative images from three independent experiments are shown with scale bar of 5 µM. H Bar graph shows the percentage of LAPosomes formed per cell upon zymosan stimulation (1 h up to 24 h) in macrophages overexpressing Flag-ATG4Bwt or Flag-ATG4BC78S. Bars represent the fraction of total mean of five independent experiments. One-way ANOVA test. Source data are provided as a Source Data file.

