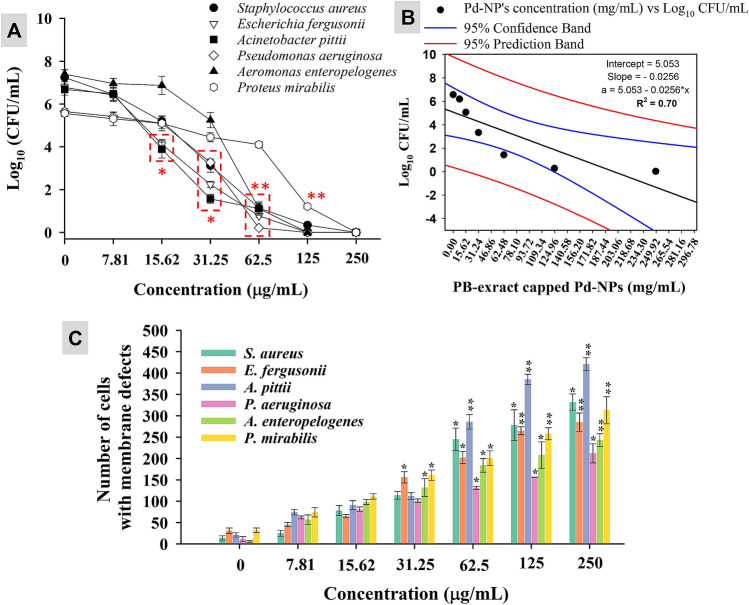
Figure 7.
PB extract-capped Pd-NPs concentration (7.81–250 µg/mL) dependent CFU count of bacterial cultures (panel A), regression analysis of average CFU/mL of all strains versus PB extract-capped Pd-NPs concentration (panel B), and impact of PB extract-capped Pd-NPs on cell membrane permeability (panel C). Data represents mean values of three independent replicates and error bars represent standard deviation (S.D.). *P ≤ 0.05 and **P ≤ 0.01 based on student’s t-test.

