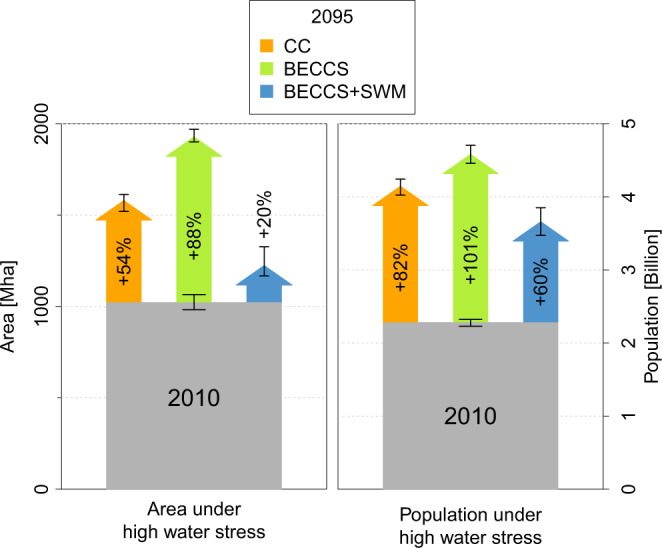
Fig. 1. Simulated increase of area and population exposed to high water stress from around 2010 (2006–2015) to 2095 (2090–2099) in the different scenarios: CC (climate change), BECCS (bioenergy with carbon capture and storage), BECCS+SWM (BECCS with sustainable water management).

The numbers represent global sums of grid-cell-level area and population, respectively, where annual mean WSI > 40%. Shown are the mean change and the ranges resulting from the differences in climate simulations based on the four GCMs. Gray bars represent the current (2006–2015 average) levels.
