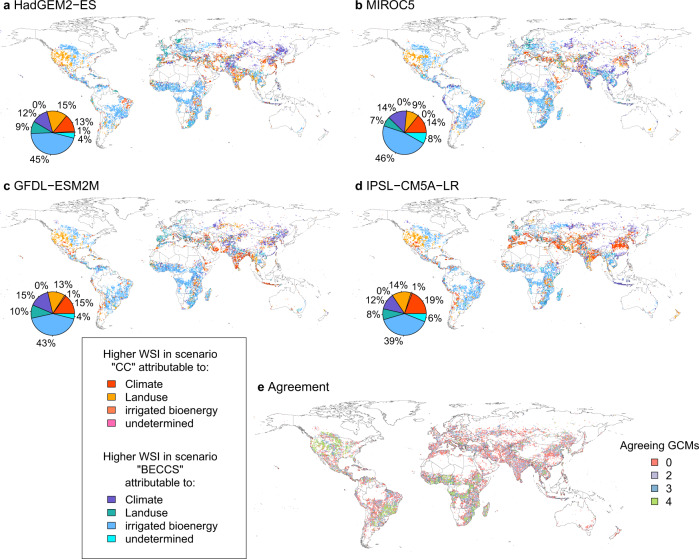
Fig. 4. Attribution of main driver explaining differences in water stress between the scenarios BECCS and CC.
a–d Higher water stress in BECCS is indicated by blueish colors, the opposite in reddish colors. Drivers are attributed by factorial simulation experiments keeping either land use, climate, or irrigation on biomass plantations constant (see Methods—attribution of drivers for water stress differences). The global area shares of each category are displayed to the bottom-left of each map. e Number of GCMs that agree on the attributed driver in a grid cell.

