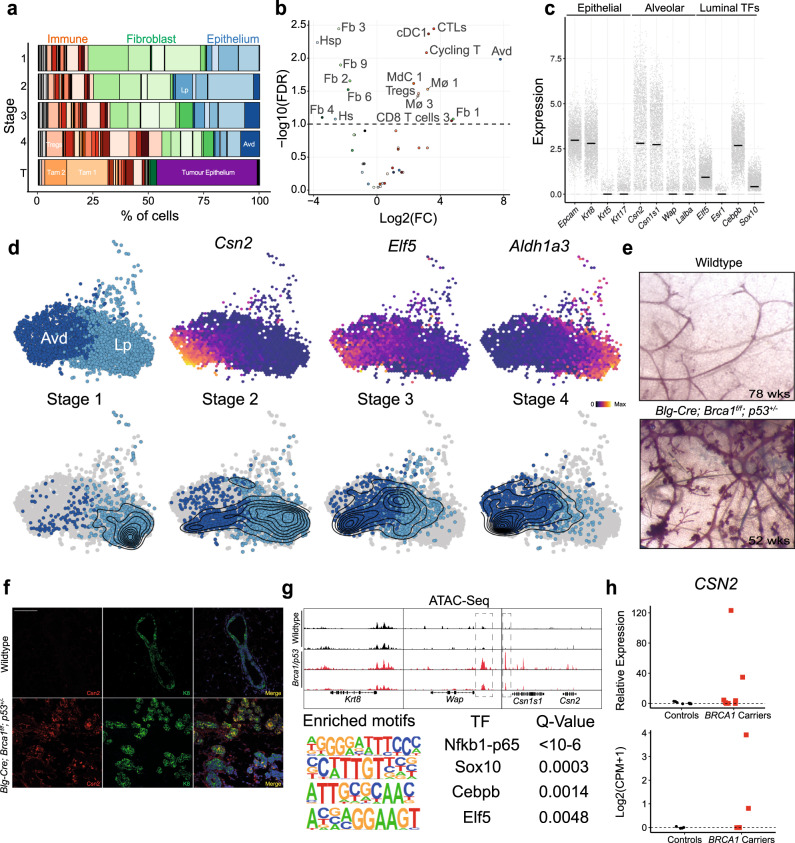
Fig. 2. Luminal progenitor cells aberrantly differentiate towards an alveolar fate during BRCA1 LOF-dependent TNBC development.
a Cell type composition of all Blg-Cre; Brca1f/f; p53+/− samples grouped by stages. Key cell types are highlighted, for full annotation see Supplementary Fig. 3a. b Volcano plot showing the results of the differential abundance test during tumour development from stage 1 to 4. The logFC represents the coefficient of a robust regression of normalised log-transformed cell type abundance on the 0–1 scaled PC1 values from Fig. 1c. Colour scheme corresponds to a and Supplementary Fig. 3. c Gene expression of various lineage-markers for the Avd cluster. Expression values represent normalised, log-transformed counts. The horizontal line depicts the median expression. Expression values are derived from n = 15 independent animals. d UMAP coordinates from Fig. 1, only showing the Lp and Avd cluster. The top row highlights the location of the two clusters as well as gene expression of three marker genes. The bottom row is facetted by stages with overlaid density estimate. e Wholemounts of mammary glands from wild-type and Blg-Cre; Brca1f/f; p53+/− animals. Weeks (wks) of age are shown in the bottom right corner. Additional examples are shown in Supplementary Fig. 3c. f Immunofluorescence staining for Csn2 (red), Cytokeratin-8 (K8, green) and DAPI (blue) from wild-type (top row) and Blg-Cre; Brca1f/f; p53+/− (bottom row) mammary glands. Scale bars represent 100 µm. Ten individual images from three independent animals were analysed. g ATAC-sequencing data from sorted luminal progenitor cells of wild-type (top) and Blg-Cre; Brca1f/f; p53+/− (bottom) animals. h Expression of CSN2 in sorted luminal progenitors from either reduction mammoplasties of healthy controls or prophylactic mastectomies from BRCA1 carriers. The top panel shows expression in eight controls and eight BRCA1 carriers of CSN2 as measured by qPCR. The bottom panel shows expression in four controls vs. four BRCA1 carriers as measured by RNA-sequencing of sorted luminal progenitors. FC fold change, TF transcription factor, CPM counts per million. Source data for the qPCR is provided as a source data file.

