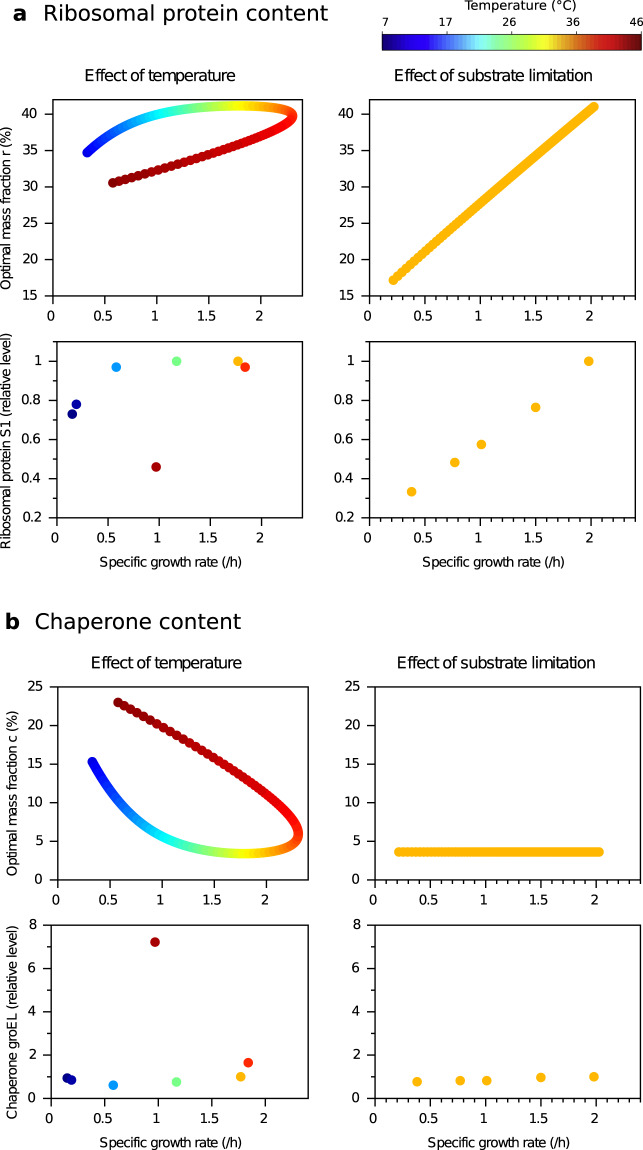
Fig. 3. Protein sector content for ribosomal proteins and chaperones as a function of specific growth rate, varying with temperature (left) or substrate limitation (right).
a Ribosomal protein mass fraction. Top: model prediction. Down: Level of the ribosomal protein S1 in E. coli for different temperatures in glucose rich medium (left), and for different media at 37 ∘C, relative to glucose-rich medium at 37 ∘C22,36. For each point, color represents temperature (see colorbar). b Chaperone mass fraction. Same legend as (a) for the chaperone GroEL.

