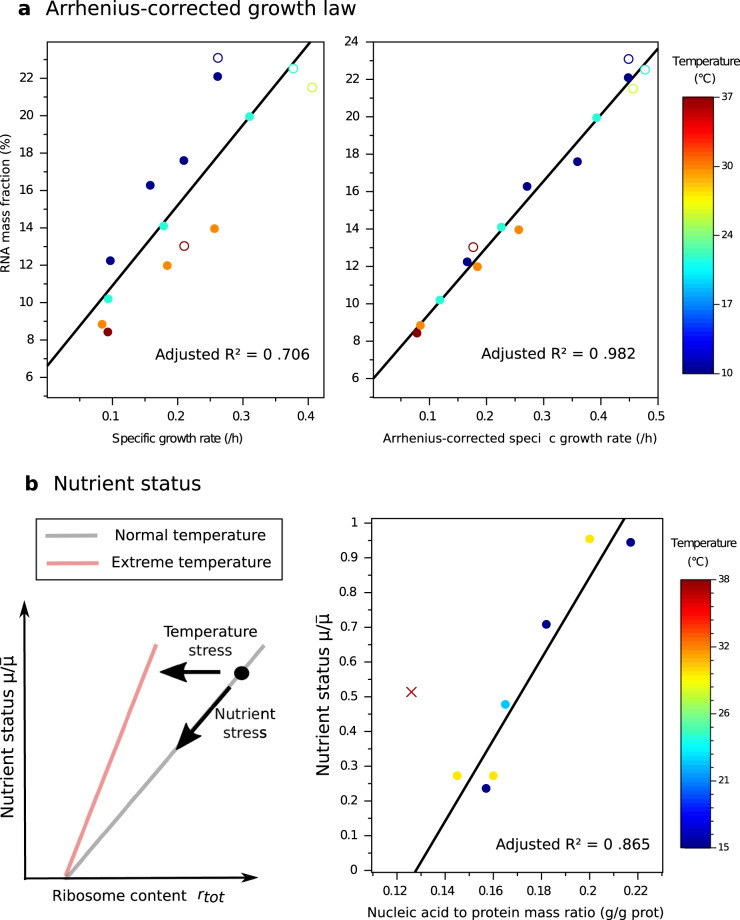
Fig. 4. Microbial growth laws accounting for temperature effects.
a Growth law between growth rate and RNA content, without (left) and with (right) Arrhenius correction (Eqs. (9)–(10)) for S. cerevisiae24. The Arrhenius correction greatly improves the linear regression, as witnessed by the increase of adjusted R2 from 0.706 to 0.982. Open symbols: batch; closed symbols: chemostat. For each point, color represents temperature (see colorbar). b Nutrient status as a function of the ribosome content. Left: the gray line represents the theoretical relationship valid for non-extreme temperatures (from Eq. (12)). At extreme temperatures, the slope changes due to chaperone burden (Eq. (11)). A decrease in ribosome content relative to a control (black dot) could be due to a substrate limitation and/or temperature stress. Right: nutrient status as a function of the nucleic acid to protein ratios for Candida utilis43. The only point above the optimal temperature for growth, marked by x, was identified as an outlier and removed from the linear regression, showing a possible effect of temperature stress in line with our prediction.

