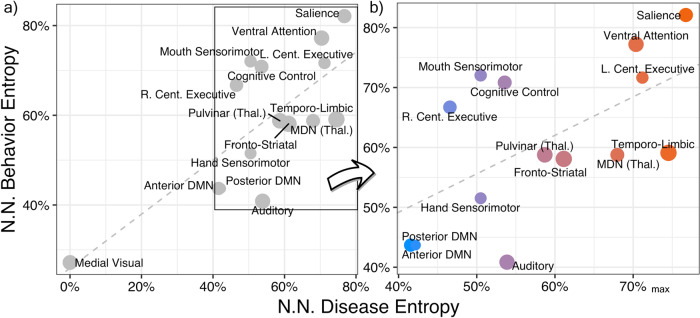
Fig. 3. Matched network disease and behavior entropy comparison.
The informational content of each network in terms of percent maximum of network normalized behavior and disease entropy. High disease entropy corresponds to a network that is associated with a higher variety of diseases [from n = 43 International Classification of Disease (10th version) diagnostic categories] and is non-specific to one or few diseases. High behavior entropy corresponds to a functional network associated with a high variety of Behaviors (from n = 56 BrainMap behavior domains) and is also not specialized. Only those n = 15 networks that are significantly matched between co-alteration and task-activation ICA are displayed; the size of data points is proportional to their spatial correlation (0.31 ≤ r ≤ 0.62). The linear model a had the following parameters: β = 0.60; p = 0.0006; df = 13; Adjusted R2 = 0.53. Panel b excludes the medial visual network from view, where color corresponds to the fitted values of the model. NN network normalized, MDN medial dorsal nucleus, DMN default-mode network, Thal. thalamus, L./R. left/right, Cent. central. Source data are provided in Supplementary Data 1.

