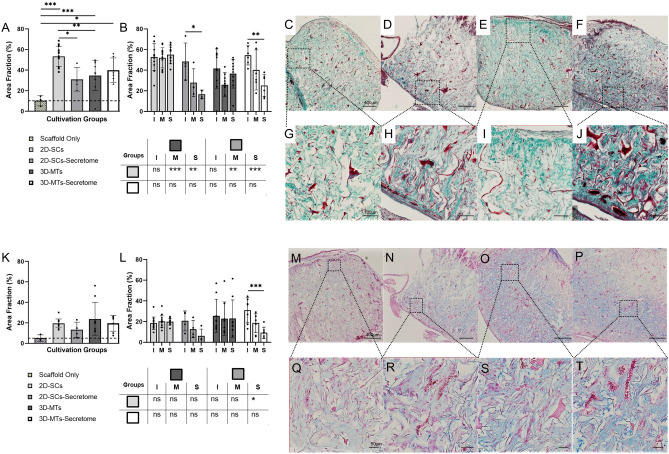
Figure 4.
Histological analysis of collagen and glycosaminoglycan formation into the natural collagen scaffold (Optimaix). Histological analysis of collagen (A–J) and GAG (K–T) of the four cultivation groups are assessed on day 7. An additional scaffold only group was assessed to provide a reference what amount is stained by the scaffold itself. Results are presented in a group comparison of the total scaffold (A, K) and more specified in differing three ROIs (interface (I), middle (M) and the surface (S)) (B, L). Significances of intra-group calculations are demonstrated within the graph whereas inter-group differences with its corresponding ROIs are shown on the separate tables. The results are illustrated with an exemplary out-take of each cultivation group using single-cells (C, G, M, Q), 2D-SCs-secretome (D, H, N, R), 3D-microtissues (E, I, O, S), 3D-MT-Secretome (F, J, P, T). An exemplary part of the interface region is shown for each group (G–J, Q–T). The scale bar was defined with 400 µm in the overview examples (C–F, M–P) in both stains and 100 µm for the more detailed examples of collagen formation (G–J) and 50 µm of GAG formation (Q–T). Statistical results were established with a one-way ANOVA considering only one independent factor and a two-way ANOVA considering two categorical factors and the effect of the categorical factors on each other. P-values were considered significant by the APA-System: 0.12 (ns), 0.033 (*), 0.002 (**), < 0.001 (***).

