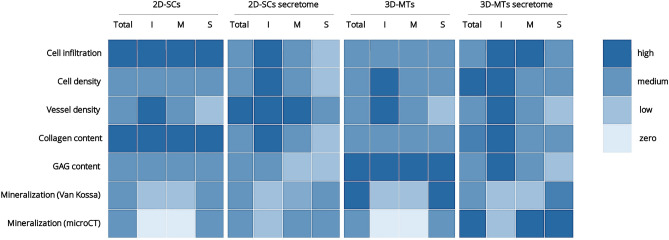
Figure 6.
Heat map showing overview of key results. All quantitative results were assigned to one of the following categories zero, low, medium and high and color-coded accordingly. The investigated scaffolds of the four experimental groups 2D-single cells (2D-SCs), 3D-microtissues (3D-MTs) and corresponding secretomes were either analyzed as an entire scaffold (Total) or one of the three regions interface (I), middle (M) and surface (S).

