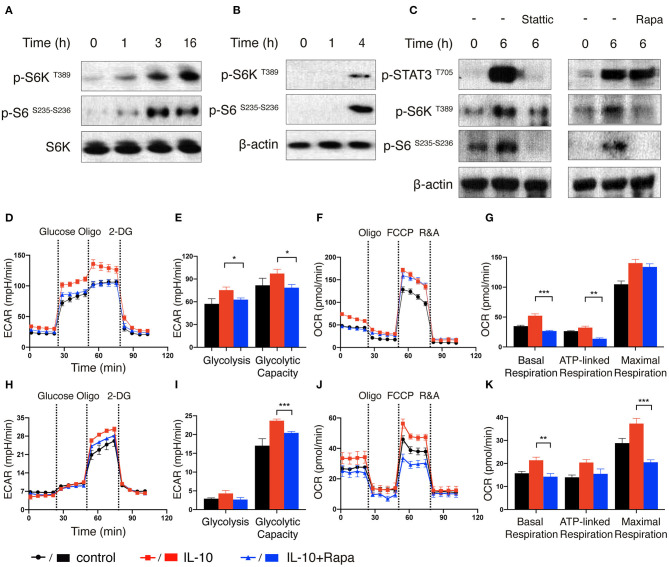
Figure 5.
mTORC1 signaling is induced by IL-10 treatment and regulates metabolic reprogramming of NK cells. (A–C) Immunoblot analysis of STAT3 and mTORC1 activation in IL-10 stimulated NK cells. Ex vivo expanded NK cells were stimulated with IL-10 for 1, 3, and 16 h (A). Freshly-isolated NK cells were stimulated with IL-10 for 1 h and 4 h (B) or 6 h (C) in the absence or presence of Stattic (50 μM) or rapamycin (Rapa, 20 nM). The expression of p-STAT3 T705, p-S6K T389, p-S6 S235−S236 as well as S6K and β-actin in NK cells were analyzed by western blot. (D–G) Real-time analysis of ECAR and OCR of ex vivo expanded NK cells with or without the treatment of IL-10 or rapamycin. NK cells were stimulated with IL-10 in the presence or absence of rapamycin for 16 h or left unstimulated. The ECAR (D) and OCR (F) of ex vivo expanded NK cells were analyzed in real time as described in Figure 2. The glycolysis and glycolytic capacity (E), as well as basal respiration, ATP-linked respiration and maximal respiration (G) of ex vivo expanded NK cells were quantified. (H–K) Real-time analysis of ECAR and OCR of freshly-isolated NK cells with or without the treatment of IL-10 or rapamycin. The ECAR (H) and OCR (J) of NK cells were analyzed in real time. The glycolysis and glycolytic capacity (I) as well as basal respiration, ATP-linked respiration and maximal respiration (K) of freshly-isolated NK cells were quantified. The results were presented as Mean ± SEM [n = 6 for (D–G), n = 4-5 for (H–K)]. Data were compared using One-way ANOVA with Dunnett's multiple comparison test. *P < 0.05, **P < 0.01, ***P < 0.001.

