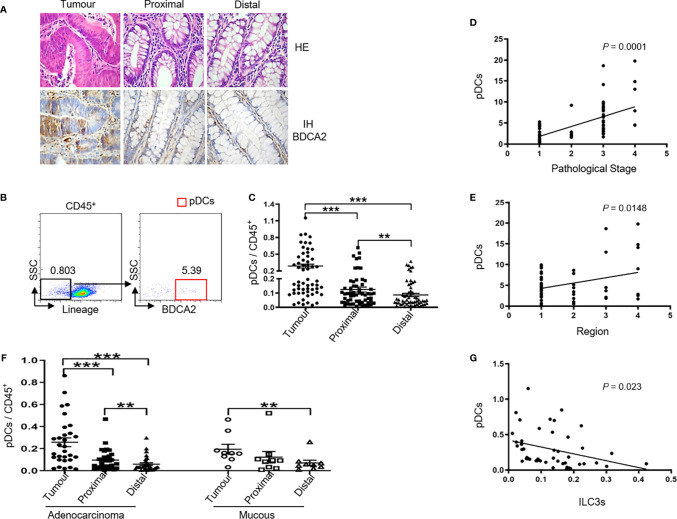
Figure 2.
Tumor ILC3s are negatively correlated with tumor pDC levels. MNCs from tumor, proximal, and distal regions of 58 patients with colon cancer were prepared. (A) Representative H&E and immunohistochemistry staining of BDCA2 in tumor, proximal, and distal tissues from patients are shown (magnification, 400×). (B) The gating used to define pDCs: MNCs were stained for Lin, CD94, CD34, CD1a, TCRα/β, TCRγ/δ, CD45, BDCA2, and pDCs were identified as Lin− CD94− CD34− CD1a− TCRα/β− TCRγ/δ− CD45+ BDCA2+. (C) pDC levels among CD45+ cells in the indicated tissues. (D) Correlation between the percentage of pDCs in tumor (T) versus distal (D) tissue specimens and the pathological stage of colon cancer. (E) Correlation between the percentage of pDCs in tumor (T) versus distal (D) tissue specimens and the region of the tumor in the colon: 1, 2, 3, and 4 represent ascending, transverse, descending, and sigmoid colon, respectively. (F) Percentage of pDCs among CD45+ cells in colon glandular cancer and mucous carcinoma tissues. (G) Correlation between the number of ILC3s and pDCs among tumor infiltrating CD45+ cells. In (B, D, E, G), each dot represents one patient. In (C, F), each symbol (circle, tumor; square, proximal region; triangle, distal region) represents the indicated tissue specimen from one patient. A paired t-test and Spearman test were used for statistical comparisons. *P < 0.05; **P < 0.01; ***P < 0.001.

