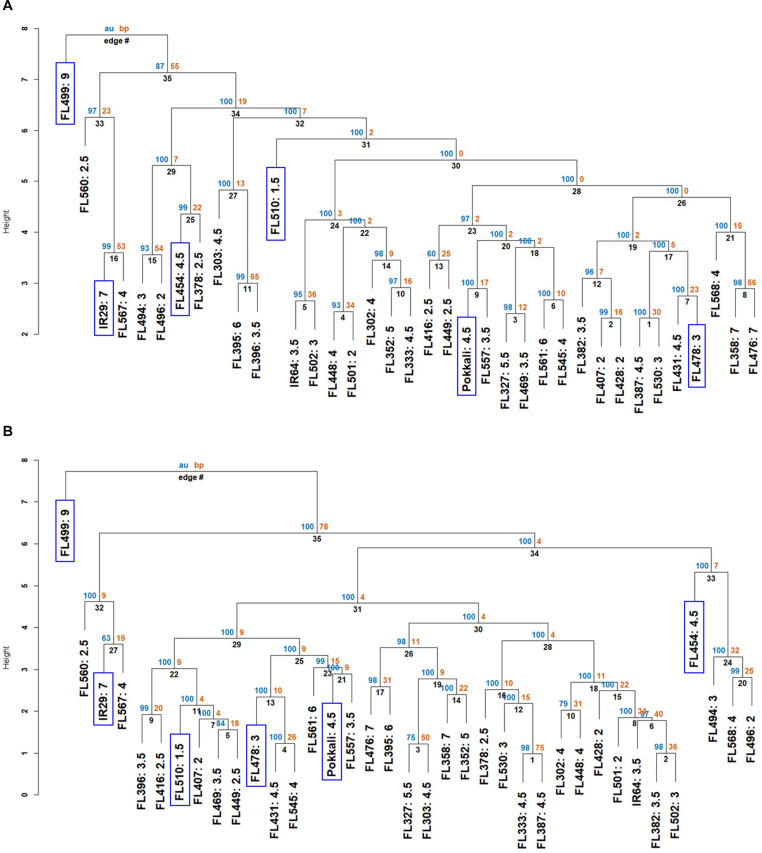
FIGURE 2.
Neighbor-joining dendrograms showing two layers of similarities based on the phenotypic matrix (APS and SES). Each genotype in the dendrogram is suffixed with their SES. The individual genotypes (parents, RILs) that were investigated to understand the physiological mechanisms are highlighted in blue boxes. AU (blue) refers to the adjusted P-value of clustering, and BP (orange) refers to the bootstrapping value of “pvclust” package. The y-axis of each dendrogram refers to the degree of separation (height) between groups. (A) Similarities based on the entire matrix (components of APS + SES). Dendrogram shows the poor genotypes represented by IR29, FL454, and FL499 forming distinct clades from the good genotypes represented by Pokkali, FL478, and FL510. (B) Similarities based on APS components relevant to Na+ sequestration (ELI, Na+, and K+ contents at control and 144 h, Na+/K+ ratio). Dendrogram shows the tendency for individuals carrying the Pokkali Saltol allele to cluster together within one large clade. In both (A,B), the super-sensitive FL499 had the earliest divergence.

