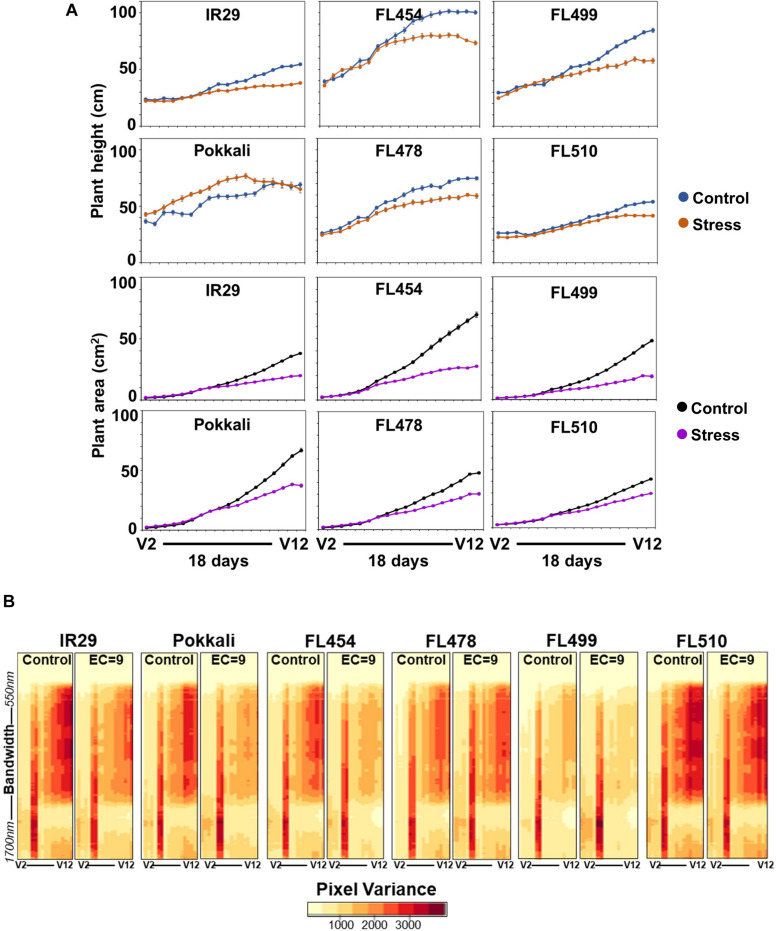
FIGURE 3.
Real-time growth profiling of the sensitive parent IR29, tolerant parent Pokkali, sensitive RIL FL454, tolerant RIL FL478, super-sensitive RIL FL499, and super-tolerant RIL FL510 at EC = 9 dSm–1. (A) Growth curves as a function of changes in plant area and plant height (y-axis, as cm2 and cm, respectively) during the 18-day period of stress (x-axis, plotted as the vegetative growth stages V2 to V12), calculated based on pixels captured by RGB and hyperspectral camera. Note the time of forking between the control and stress curves and the angle of the fork, reflective of growth plateauing. (B) Variation in hyperspectral variance at 243 wavelength bands ranging from 550 to 1,700 nm. Heat maps of hyperspectral variances are potential indicators of overall plant health and stress injuries. The overall patterns in hyperspectral variances mirror the patterns revealed by the growth curve analysis.

