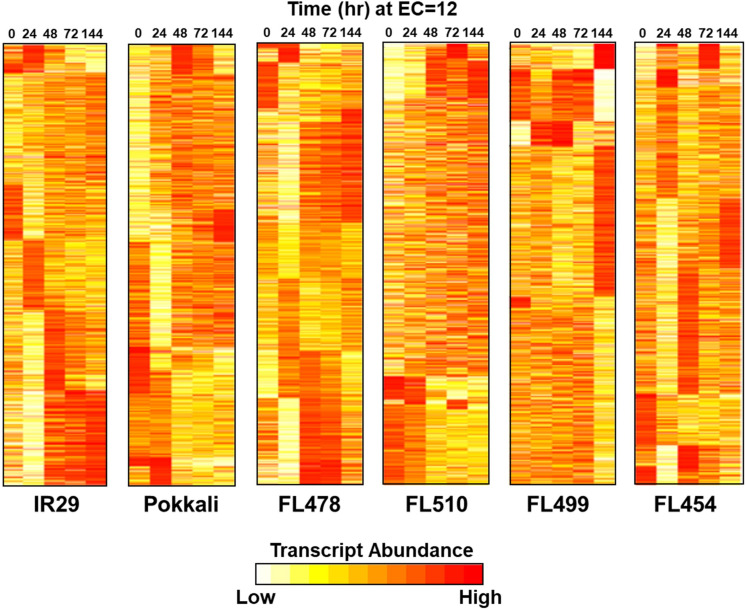
FIGURE 5.
Temporal profiles of salinity stress (EC = 12 dS m–1) transcriptomes in parents (IR29 = sensitive; Pokkali = tolerant) and their RILs (FL454 = sensitive; FL499 = super-sensitive; FL478 = tolerant; FL510 = super-tolerant). Parallel comparison of transcriptomes across genotype shown as K-means++ clusters included 14,696 unique transcript loci. The super-tolerant FL510 is the most unique, having gradual changes in expression. The other genotypes have large clusters of co-expressed genes with drastic upregulation or downregulation across time.

