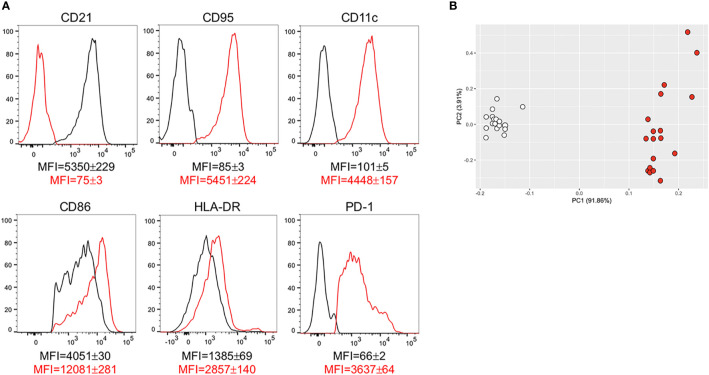
Figure 4.
DN B cells are characterized by higher expression of IA markers associated with autoimmunity. (A) Cells were stained to evaluate the expression of several markers of IA on DN B cells from individuals with obesity and from lean controls. Results show mean fluorescence intensity (MFI)± SE for each marker in DN B cells from lean (black line) and obese (red line) individuals (18 individuals/group). (B) PCA analysis with the axes showing the percentage of variation explained by PC1 and PC2. Each symbol indicates an individual. White symbols: lean individuals. Red symbols: obese individuals.

