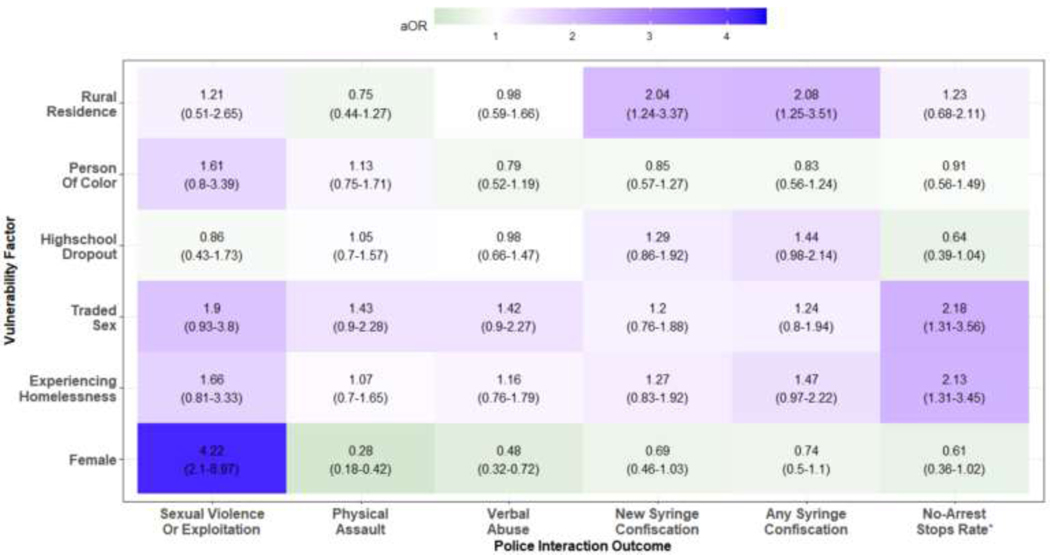
Figure 1. Multivariate Associations between Vulnerability Factors and Police Interaction Outcomes.
Each column represents one multivariable regression between a police interaction outcome and 6 vulnerability factors. The adjusted odds-ratio for each vulnerability factor is shown in text, as well as the associated 95% confidence interval in parentheses. The color scale indicates the direction of the association, where green is protective, and purple indicates heightened risk.

