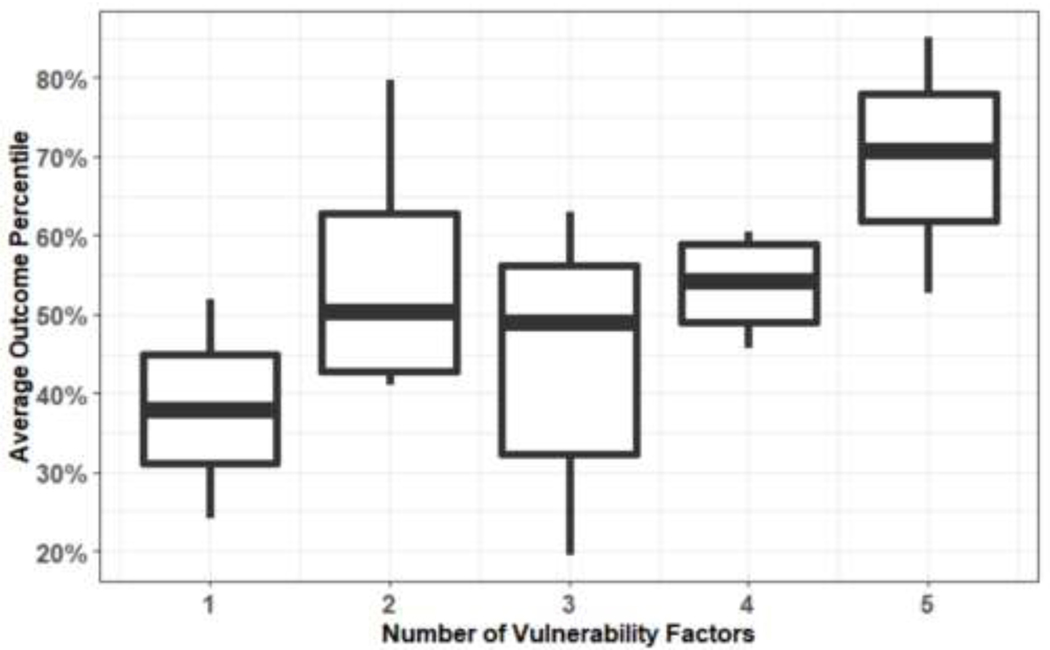
Figure 3. The Average Police Outcome Score by Number of Vulnerability Scores.
The distribution of average outcome scores across all police interaction outcomes is shown as a boxplot, separate by number of vulnerability factors. This represents the distribution of values shown in the bottom panel of Figure 2, organized by the number of vulnerability factors (represented by color in the top two panels of Figure 2).

