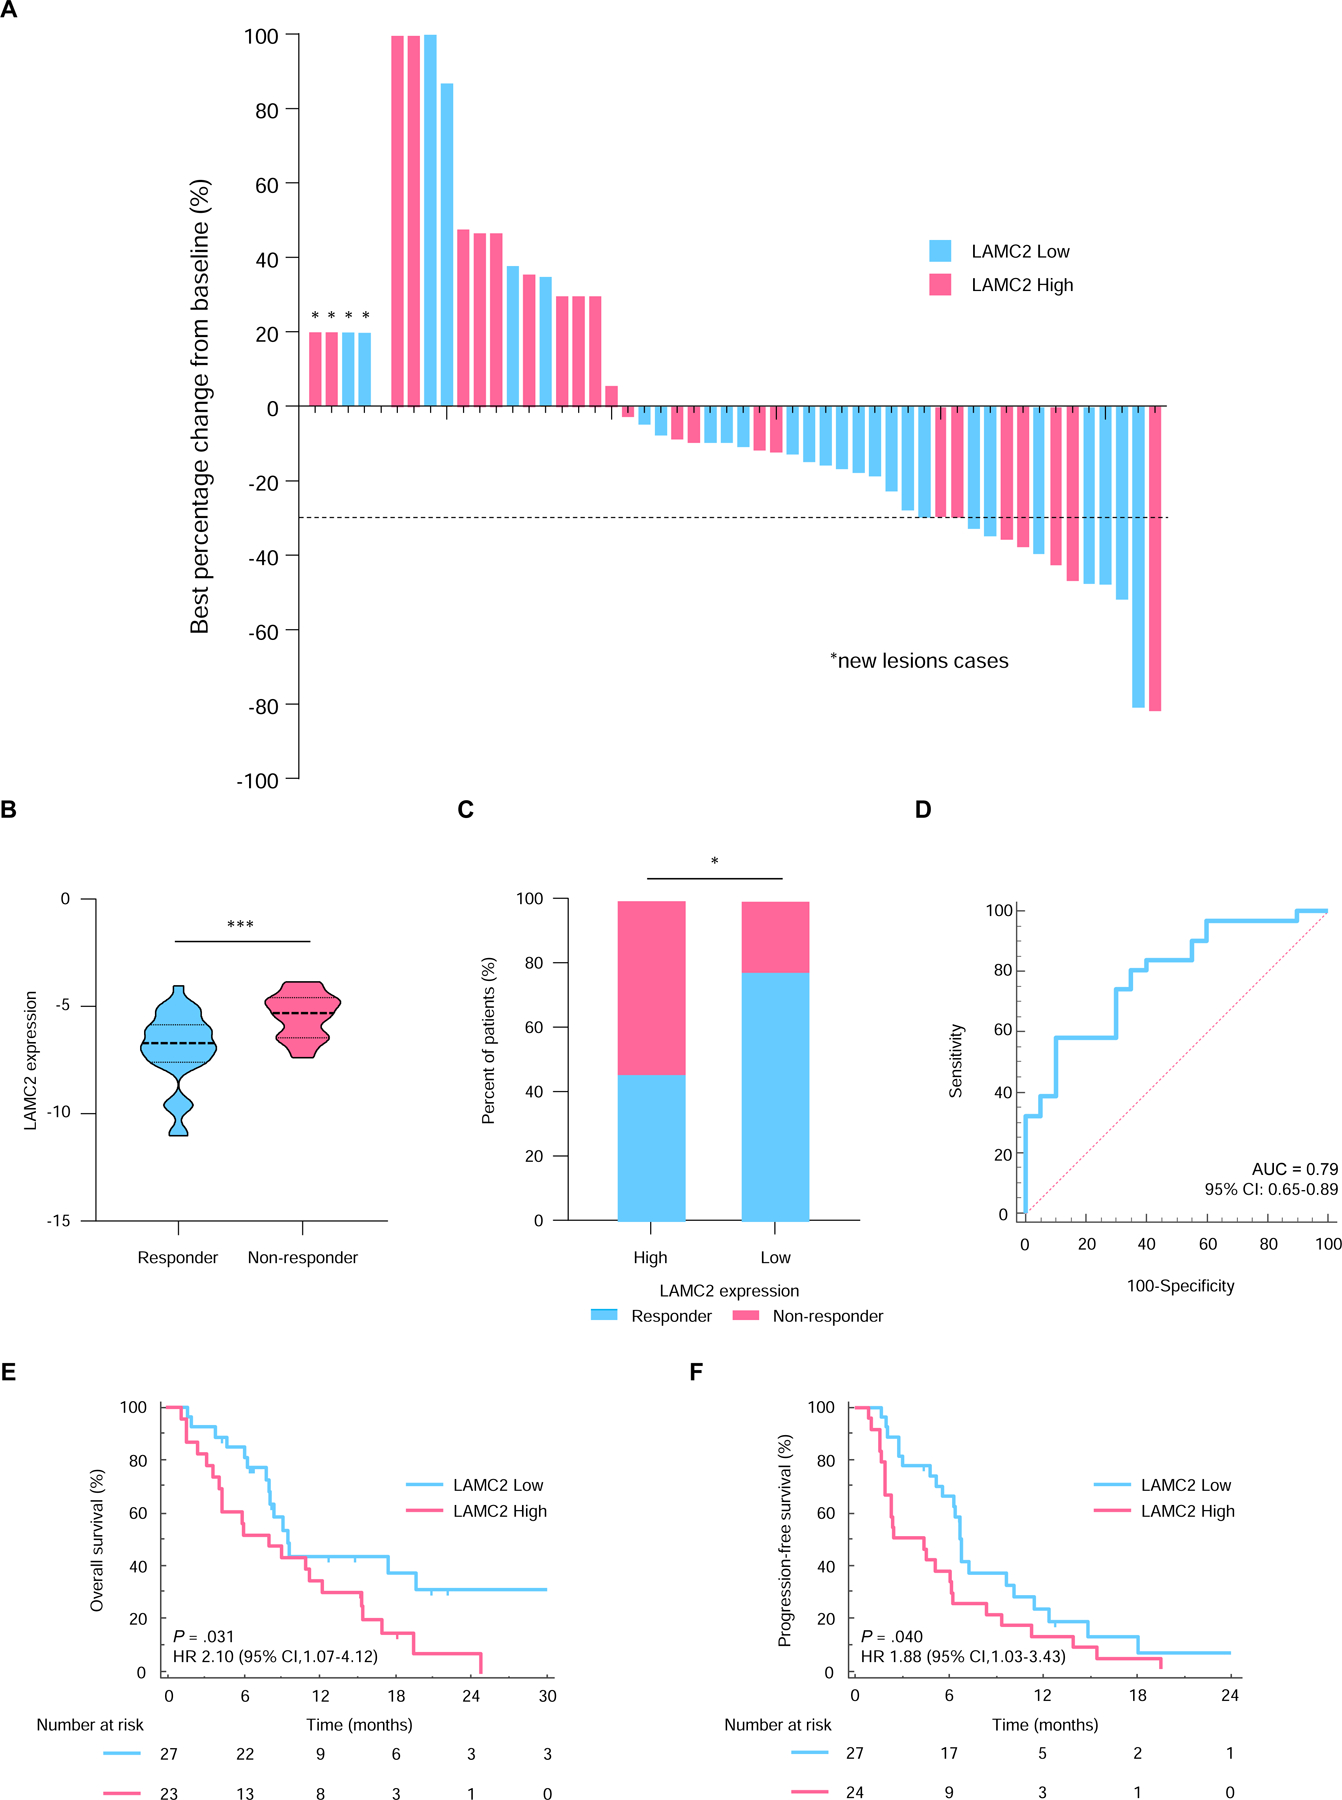
Figure 3.

LAMC2 expression predicts therapeutic response to gemcitabine-based therapy. (A) Waterfall plots for predicting best tumor response in PDAC patients treated with gemcitabine and nab-paclitaxel as a primary treatment. (B) Comparison of LAMC2 expression levels in responders and non-responders in the primary chemotherapy cohort. (C) The proportion of responders and non-responders in the LAMC2-high and low patients. (D) ROC curves for the predicting therapeutic response to gemcitabine. Kaplan-Meier curves for (E) OS and (F) PFS in PDAC patients with high (pink) or low (blue) LAMC2 expression in the primary chemotherapy cohort. *, P<0.05; **P<0.001.
