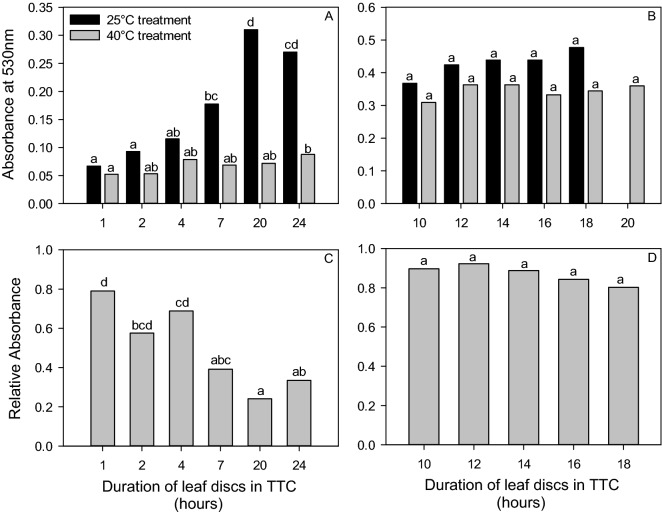
Figure 5.
ANOVA and post hoc Tukey test results (depicted as lower-case letters) showing the differences between measurements with respect to duration of leaf disc submersion in TTC. Pane (A) and (B) show absorbance at 530 nm for leaf tissue incubated at 25 °C (Abs25, black bars) and 40 °C (Abs40, grey bars), where Run 1 with durations from 1 to 24 h is shown in pane (A), and Run 2 with durations 10–18 h is shown in Pane (B). Relative absorbance values are shown in Panes (C) (Run 1 with durations from 1 to 24 h) and (D) (Run 2 with durations 10 to 18 h).

