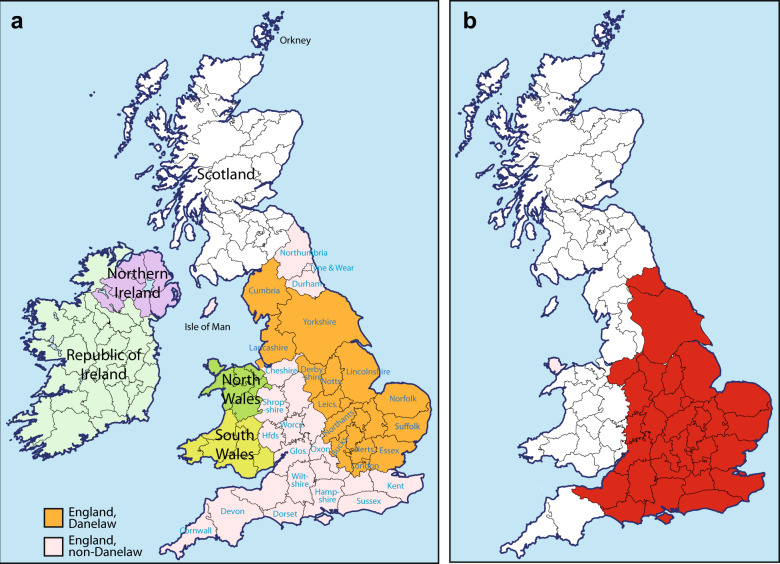
Fig. 1. Map of Britain and Ireland showing the Danelaw, the regions sampled, and the predominant PoBI autosomal cluster.
a English counties (named in blue font) and regions studied here, and the extent of the Danelaw, the region under Scandinavian control from the late ninth to the late eleventh century; b Extent (in red) of the predominant cluster revealed by FineSTRUCTURE analysis in the Leslie et al. study [8] of autosomal SNP data in the PoBI samples (referred to there as ‘Central/South England’). Bucks. Buckinghamshire; Glos. Gloucestershire; Herts. Hertfordshire; Hfds. Herefordshire; Leics. Leicestershire; Northants. Northamptonshire; Notts. Nottinghamshire; Oxon Oxfordshire. Map images modified from an original work by Wikishire, CC BY-SA 4.0, https://commons.wikimedia.org/w/index.php?curid=36830415.

