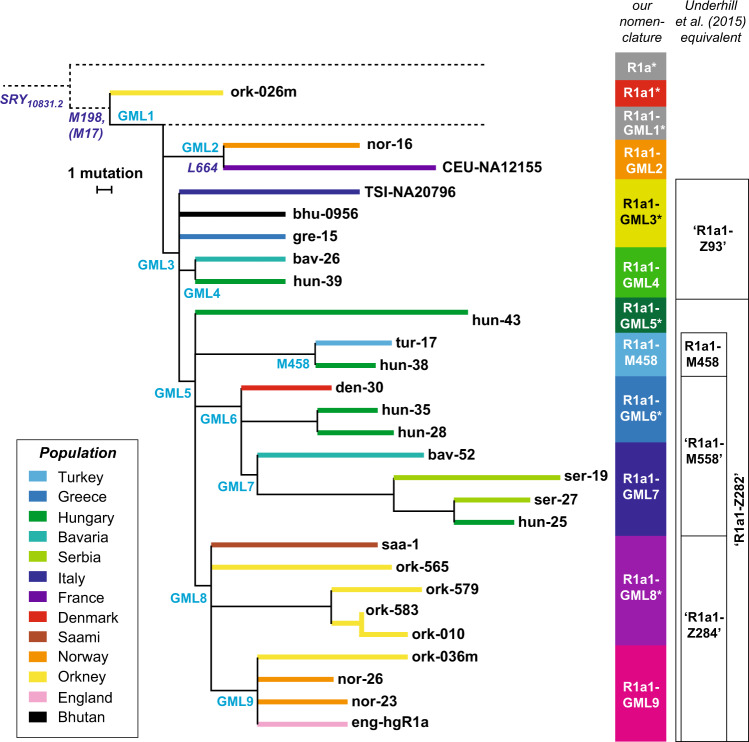
Fig. 2. Subdivision of haplogroup R1a1 based on sequencing data.
Phylogeny [25] including 27 different MSY sequences, with branch lengths proportional to the number of single-nucleotide mutations. Terminal branches are coloured by population, as shown in the key, and sample names are given at the tips of branches. SNPs chosen for typing in this study are indicated on relevant branches in plain text. Other mutations (e.g., L664) are in italics, and were not typed in all samples. To the right is indicated the approximate equivalence to lineages previously identified [23, 34], and verified in this study. Nomenclature of R1a and R1a1 here is according to ref. [50]. Unobserved lineages, including the deep-rooting paragroup R1a1-GML1*, are indicated by dotted lines.

