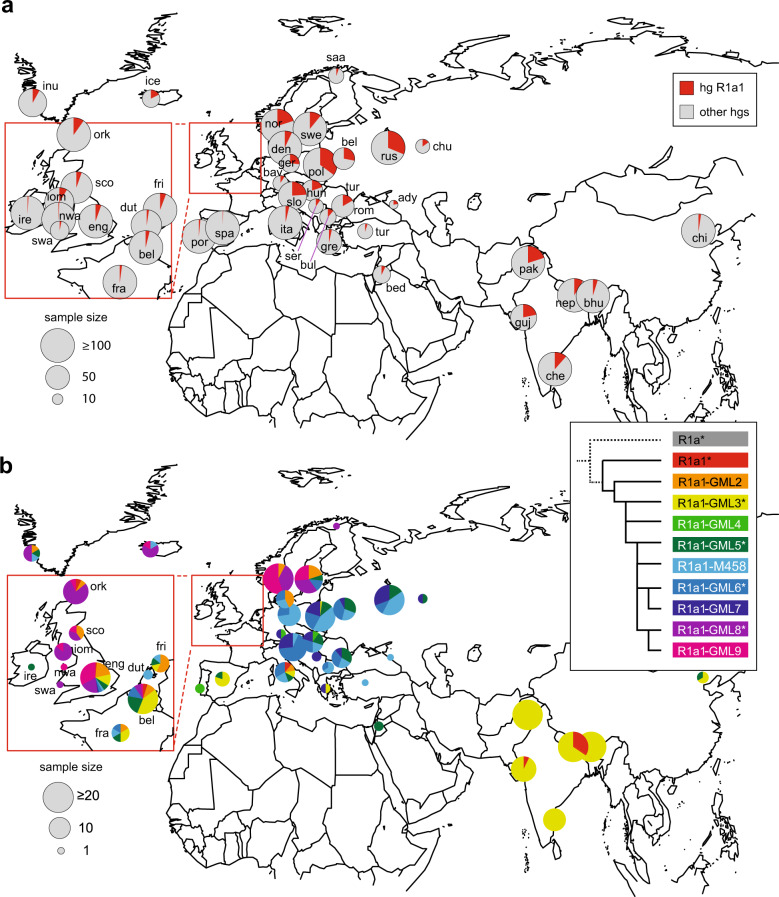
Fig. 3. Geographical distributions of haplogroup R1a1 and its sub-haplogroups.
a Distribution of haplogroup R1a1 in the analysed samples. Pie-charts indicate populations, with area proportional to sample size up to 100, as indicated in the key, and the red sector showing the proportion of hg R1a1. b Distribution of sub-haplogroups of R1a1. Populations are represented by pie-charts with area proportional to hg R1a1 sample size up to 20, as indicated in the key, and sectors indicating sub-haplogroup frequencies within R1a1, according to the colour-coded phylogeny top right. Populations in the British Isles and surroundings are labelled as follows: ork Orcadian; sco Scottish mainland; eng English; ire Irish; iom Isle of Man; nwa North Wales; swa South Wales; fre French; bel Belgian; dut Dutch; fra French; fri Frisian; other populations are: ady Adygei; bav Bavarian; bed Bedouin; bel Belarusian; bhu Bhutanese; bul Bulgarian; che Chennai; chi Chinese; chu Chuvash; den Danish; ger German; gre Greek; guj Gujarati; hun Hungarian; ice Icelandic; inu Inuit; nep Nepalese; nor Norwegian; pak Pakistani; pol Polish; por Portuguese; rom Romanian; rus Russian; saa Saami; ser Serbian; slo Slovenian; spa Spanish; swe Swedish; tur Turkish. Additional information about the frequency distributions of sub-haplogroups can be found in Tables S1 and S5.

