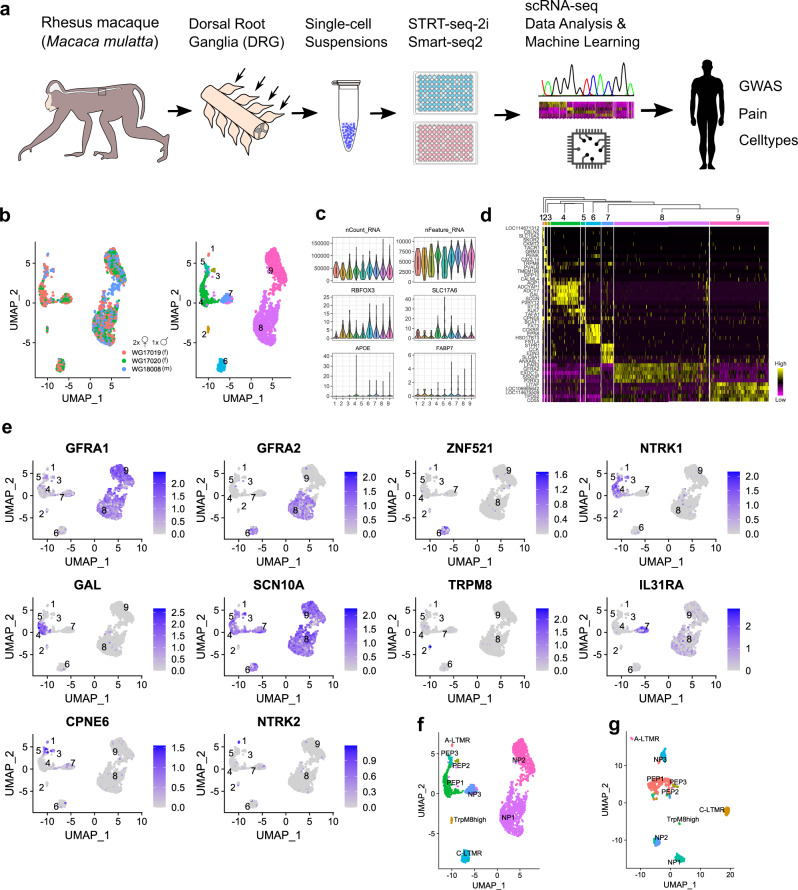
Fig. 1. Somatosensory neuron clusters in the macaque DRG.
a A schematic view of the workflow. b UMAP plots showing (left) the contribution of individual animals (N = 3) to STRT-2i-seq clusters and (right) final cluster numbers (m = male, f = female). c Violin plots showing total counts of unique transcripts, detected genes, and transcript counts for neuronal and satellite-glia marker genes in the neuronal clusters. Y-axes show detected genes per cell for nFeature_RNA; all others are raw UMI counts. Boxplot defines the median, interquartile range (IQR), and 1.5 × IQR (whiskers). d A hierarchically organized heatmap with the five most specific genes (by p-adj) for each cluster. e UMAPs showing mouse canonical marker gene expression in the STRT-2i-seq macaque clusters. f STRT-2i-seq macaque clusters named after most likely mouse counterparts. g Named Smart-seq2 clusters after label transfer from the STRT-2i-seq data. Image sources: freevectors.net (human silhouette), needpix.com (microwell plates), openclipart.org (Eppendorf tube).

