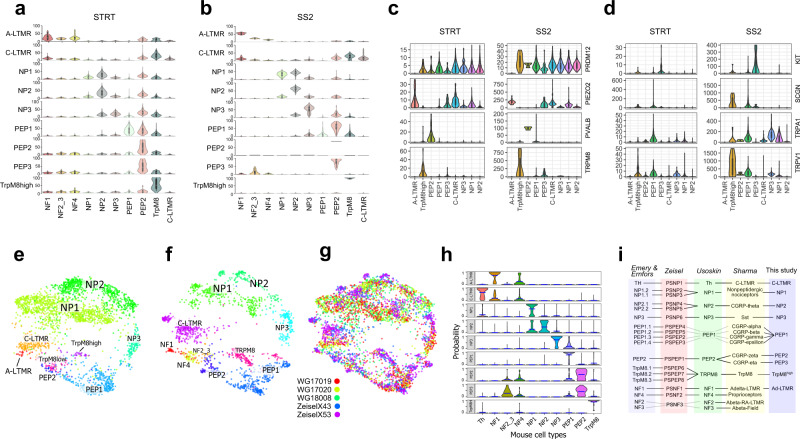
Fig. 3. Identification of primate correlates of mouse neuron types.
a, b Violin plots showing prediction percent probability scores for each macaque cluster against established mouse DRG cell types trained with Usoskin nomenclature. a STRT-2i-seq (n = 3), b Smart-seq2 (n = 5). c Violin plots of markers expressed in macaque clusters. Y-axis, raw UMI counts for STRT-2i-seq (STRT) and counts for Smart-seq2 (SS2). d Violin plots showing genes differentially expressed between macaque PEP2 and PEP3 clusters. Boxplots in a–d define the median, interquartile range (IQR), and 1.5 × IQR (whiskers). e–g LargeViz plot showing cross-species clustering of macaque STRT-2i-seq and mouse Zeisel et al. datasets on a shared plot. e Macaque, f mouse, g merged plot (legend shows origin of samples, WG = macaque, Zeisel = mouse). h Probability plot of label propagation from mouse neuron types to macaque neuron types. Horizontal blue bars represent mean position for each distribution. i Synopsis of the corresponding DRG neuron types between mouse and macaque datasets and nomenclatures.

