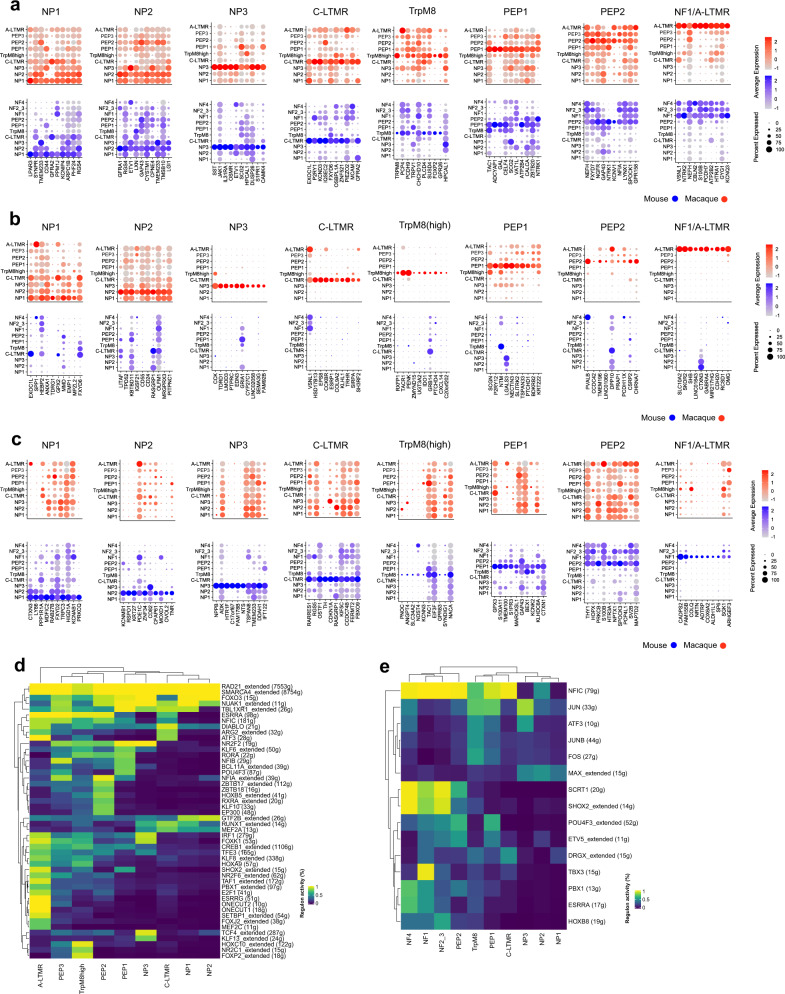
Fig. 5. Comparison of gene expression profiles across species.
a Dot plots showing ten most specific shared markers of corresponding/homologous cell types between the species. b Dot plots showing ten most macaque specific markers for each corresponding cell-type pair. c Dot plots showing ten most mouse-specific markers for each corresponding cell-type pair. Dot sizes in a–c correspond to the percentage of cells expressing the gene in the cluster and color scale indicates log2FC. d Heatmap showing binary regulon activity in each of the macaque DRG cell types. e Heatmap showing binary regulon activity in the mouse DRG cell types. In d, e the number of target genes is indicated in the parenthesis.

