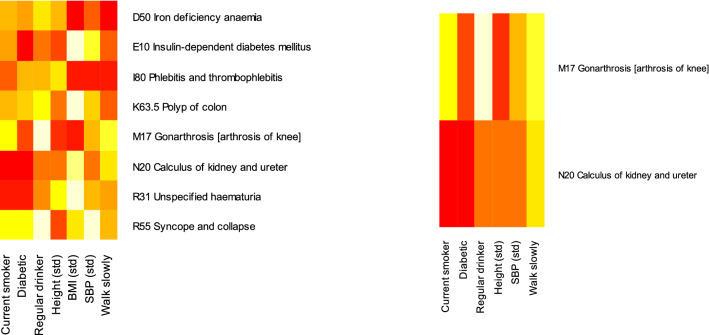
Figure 4.
Disease pairs with statistically significant differences in their associations with risk factors at the 0.05 level after an FDR multiple-testing adjustment. With all associations (left), and without BMI (right). Red indicates an association with higher risk for women than men, white a lower risk, and orange neutral. Without BMI as a risk factor, only two diseases continue to have statistically significant differences. The figures were produced with R34 and the “gplots”41 package.

