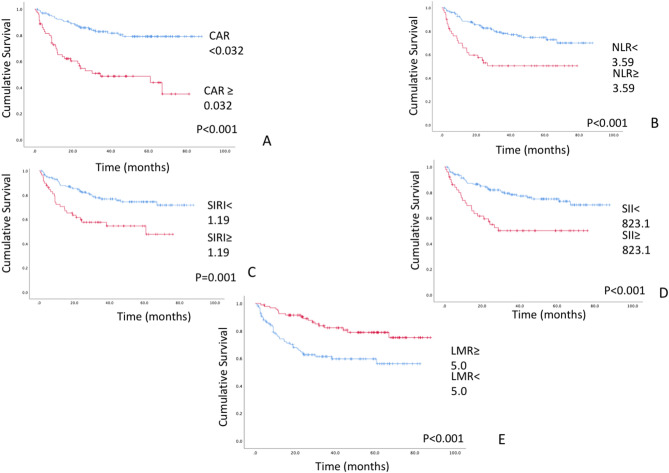
Figure 2.
(A) Kaplan–Meier survival curve according to CAR. Patients were stratified according to the cutoff value of CAR (0.032). The OS rate was 79.1% for patients with a low CAR (< 0.032) and 35% for a high CAR (≥ 0.032) (P < 0.001). (B)–(E) Kaplan–Meier survival curves according to NLR, SIRI, SII, and LMR. Significant differences in OS were noted when the patient cohort was subdivided into two groups according to the cutoff value of each inflammatory marker (NLR < 3.59, 70.0% vs. NLR ≥ 3.59, 50.4%, P < 0.001; SIRI < 1.19, 71.7% vs. SIRI ≥ 1.19, 47.7%, P = 0.001; SII < 823.1, 70.3% vs. SII ≥ 823.1, 50.1%, P < 0.001; and LMR ≥ 5.0, 75.2% vs. LMR < 5.0, 56.1%, P < 0.001). A less favorable prognosis was associated with a higher NLR, SIRI, and SII values and a lower LMR value.

