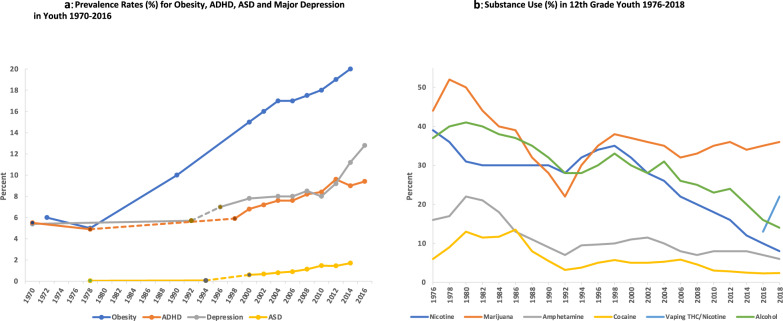
Fig. 1. Prevalence Rates for Obesity, ADHD, ASD, Major Depression and Substance Use in Youth.
a Prevalence Rates for Obesity, ADHD, ASD and Major Depression in Youth 1970–2016. Obesity rates from NCHS, National Health Examination Survey III (ages 12–17) and National Health and Nutrition Examination Surveys (NHANES) I-III, and NHANES 1999–2000, 2001–2002, 2003–2004, 2005–2006, 2007–20008, 2009–2010, 2011–2012, and 2013–2014 (https://www.niddk.nih.gov/health-information/health-statistics/overweight-obesity). Autism spectrum disorder (ASD) rates for 1970s-80s and 1980s-1990s [18]. ASD rates for 2000–2014 were from CDC (https://www.cdc.gov/ncbddd/autism/data.html). The rates for Attention Deficit Hyperactivity Disorder (ADHD) from 1998–2016 were from CDC (https://www.cdc.gov/ncbddd/adhd/timeline.html) National Health Interview Survey (NHIS) annual report 3–17 years of age. The rates for ADHD for 1972 and 1978 were taken from school community teacher surveys [16, 17]. The rates for past-year major depression episode (MDE) DSM-IV criteria are from the 12–17 age group as analyzed by Weinberger et al., 1999 with data from National Survey on Drug Use and Health (NSDUH) [6]. Depression rates for 1970 and 1992 [1]. b Substance Use in 12th Grade Youth 1976–2018. Percentage substance use for 12th graders for nicotine by smoking (30-day past use), cocaine (including crack, annual past use) and amphetamine (including Ritalin and Adderall, annual past use), marijuana (annual past use), alcohol bingeing (% who had 5+ drinks in a row at least once in the past 2 weeks) and vaping THC and nicotine (30-day past use) [58]. For cocaine, amphetamine and marijuana, 30-day past use data were only available from 1991 onwards [58].

