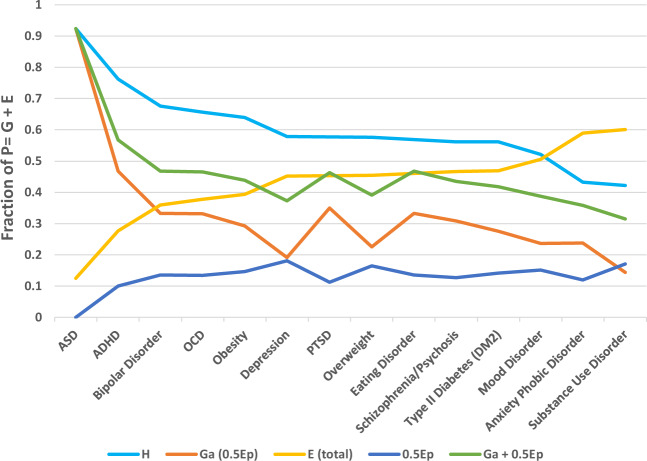
Fig. 2. Graph of 0.5Ep transmission effect for 11 neuropsychiatric disorders and 3 metabolic disorders by decreasing heritability estimate.
Shows the effects of adding 0.5 EP into the total genetic variance G and calculated additive genetic variance (GA) using estimates for heritability (H2), shared parental environmental variance (0.5 EP) and total environmental variance (E) by decreasing order of heritability for 11 neuropsychiatric disorders and 3 metabolic disorders [72].

