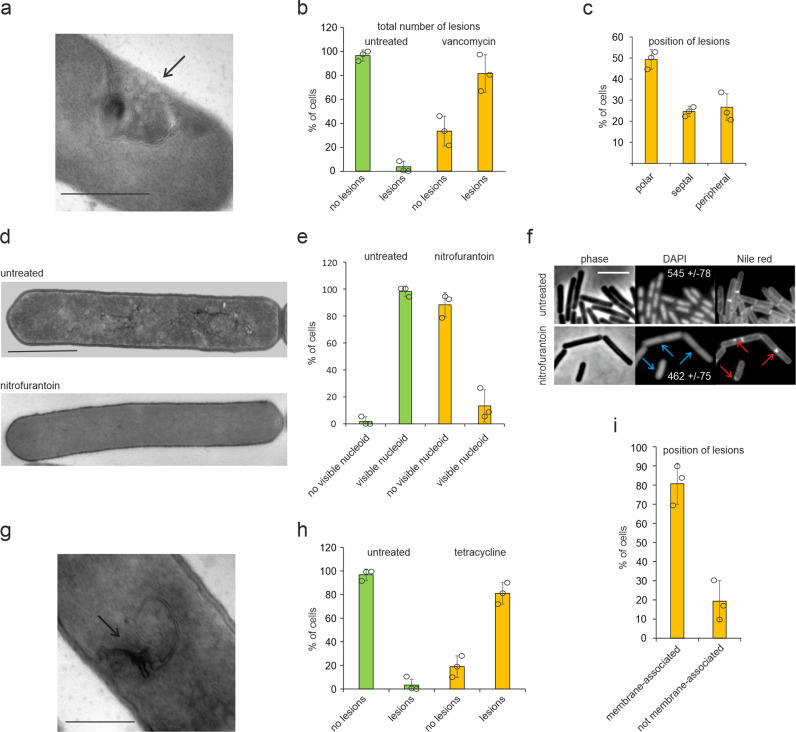
Fig. 3. Quantification of antibiotic-induced lesions based on electron micrographs.
a TEM image showing cell wall damage (arrow) caused by vancomycin. Scale bar 500 nm. b Quantification of the total number of lesions caused by vancomycin. c Position of cell wall lesions in vancomycin-treated cells. d TEM images showing deterioration of nucleoids caused by nitrofurantoin. Scale bar 1 µm. e Quantification of cells devoid of visible nucleoids in electron micrographs. Note that all nitrofurantoin-treated cells with visible DNA structures displayed a deteriorated nucleoid as shown in Supplementary Fig. 6. f Fluorescence light microscopy images of B. subtilis stained with the DNA dye DAPI and the membrane dye Nile red. Blue arrows indicate diffuse DNA stain. Numbers in the DAPI panels show average cell fluorescence quantified from three different data sets using the ImageJ analyze particles function. Red arrows indicate membrane patches. Cells were treated with 4x MIC of nitrofurantoin for 30 min. Scale bar 3 µm. g TEM image showing a lesion (arrow) caused by tetracycline. Scale bar 500 nm. h Quantification of total lesions in cells treated with tetracycline. i Quantification of different types of membrane lesions caused by tetracycline. (b, c, e, h, i) Cells were quantified manually from electron micrographs at 8000 to 15,000x magnification according to their phenotype (n ≥ 100 per condition per replicate). Error bars represent the standard deviation of three biological replicates. Circles indicate individual datapoints.

