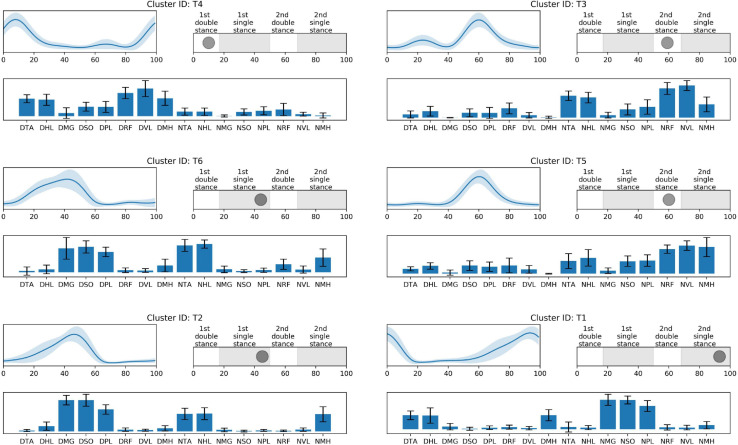
FIGURE 3.
TD-specific synergy activations (top left), structures (low), and peak activation time in the gait cycle (top right). Cluster ID is displayed above each subfigure. Synergy activations and structures are expressed as mean and standard deviation. Subfigures are arranged based on peak activation time. The labels of synergy structure are same with Figure 2.

