
Figure 5.
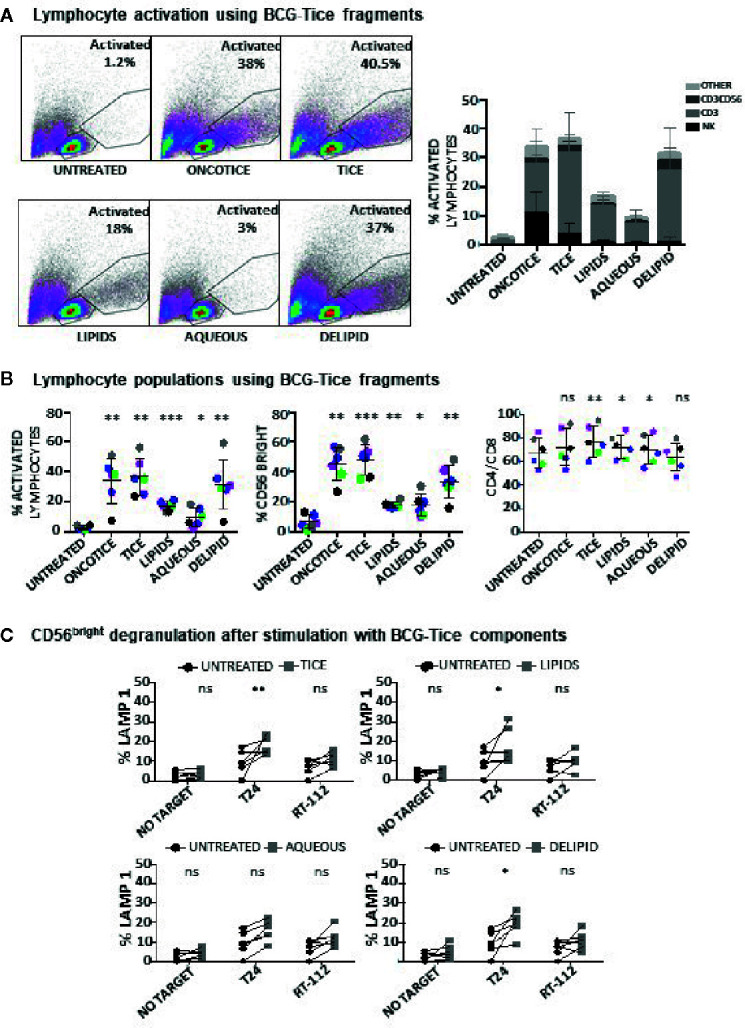
Lymphocyte activation using Tice BCG subcellular fractions. PBMCs from healthy donors were incubated with the indicated fractions of Tice BCG (see Materials and Methods). At day 7, cells in suspension were recovered from the co-culture, centrifuged and analyzed by flow cytometry. (A) The percentage of activation was determined by identifying the resting and activating lymphocyte regions by FSC vs SSC and further analyzed to distinguish T cells from NK cells by staining with antibodies against population markers (CD3, CD56). The percentage of activated lymphocytes was plotted for each donor (different populations are displayed in different shades of grey/black) (bottom). (B) The percentage of the CD56bright population was obtained within the NK cell region and percentage of CD4 vs CD8 was obtained within the CD3+ region (labelled as CD4/CD8). Data are displayed as different colors for each donor. Statistical analysis was performed using one-way ANOVA comparing each condition with the untreated culture (*p < 0.05; **p < 0.01; ***p < 0.001; ns, non-significant). (C) Degranulation of CD56bright NK cells against bladder cancer cells (T24, RT-112), was measured by analyzing surface LAMP-1 (CD107a) within the CD3-CD56+ region. Different donors are represented by symbols and compared with the untreated culture. Statistical analysis was performed using one-way ANOVA (*p < 0.05; **p < 0.01; ns, non-significant).