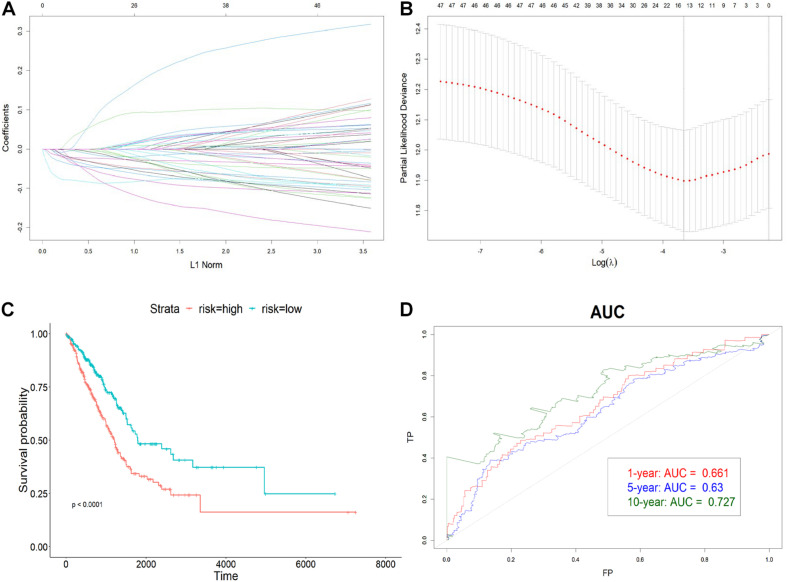
FIGURE 3.
Construction of the immune-related lncRNA signature. (A) The LASSO coefficient profiles of 19 prognosis-related lncRNAs. Each colored line showed the change of the coefficient of one lncRNA with the normalization factor. (B) Partial likelihood deviance was plotted against the logarithm of lambda in the 10-fold cross-validation. The red dots indicated the deviance and the gray vertical lines indicated standard error of the deviance. The gray vertical dotted line corresponded to the optimal lambda with the lowest partial likelihood deviance. (C) Kaplan–Meier curve of high-risk and low-risk groups. (D) The AUC of 1-, 5-, and 10-year OS. The x-axis represented the false-positive (FP) rate, and the y-axis represented the true-positive (TP) rate. The signature predicted the 10-year survival best.

