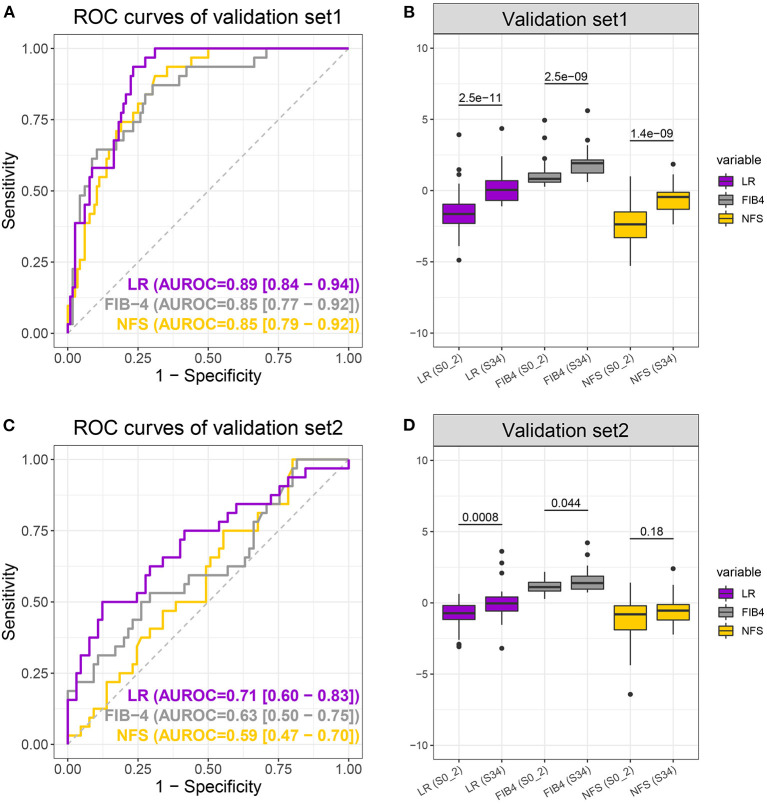
Figure 4.
Receiver operating characteristic curves (A,C) of the logistic regression (LR) model (purple), FIB-4 (gray), and non-alcoholic fatty liver disease fibrosis scores (NFS) (yellow) and boxplot (B,D) of LR, FIB-4, and NFS scores when differentiating S0–2 vs. S3–4 on the validation sets. P-values were calculated using the Wilcoxon test.

