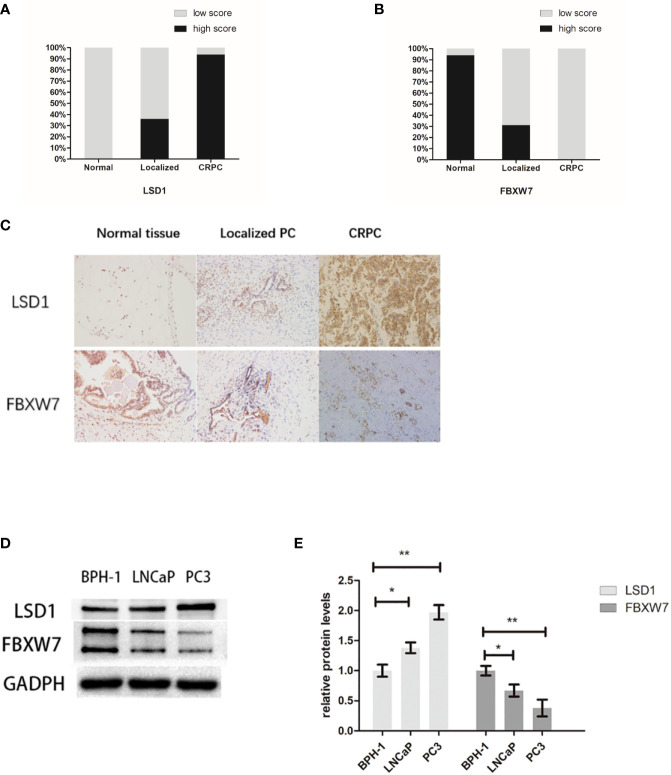
Figure 1.
LSD1 expression is up-regulation while FBXW7 expression is down-regulation in PCa. (A, B) Proportions of high intensity scores of LSD1 and FBXW7 IHC staining in normal prostate tissues (n=52), localized PCa (n=36), and CRPCa (n = 16) samples are shown. (C) Representative IHC images of expression levels of LSD1 and FBXW7 in three different tissues. (D) Representative Western blot analysis of LSD1 and FBXW7 in indicated cell lines. (E) Relative protein levels of LSD1 and FBXW7 (compared with BPH-1 cells). Values are expressed as the mean ± SEM.*P < 0.05, **P<0.01, normalized by GADPH, relative to the BPH-1 group, n = 3.

