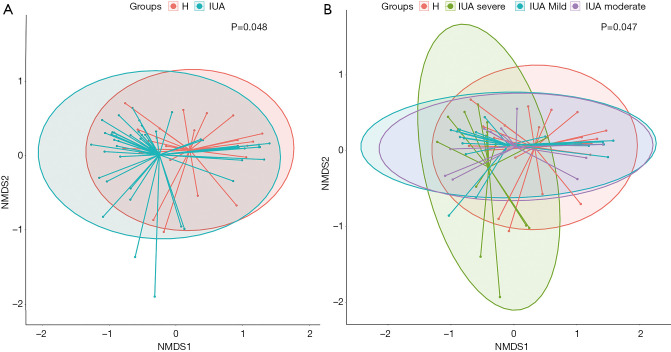
Figure 2.
Ordination plot based on weighted UniFrac distance showed the relationship between different disease states. Each point represented a sample. The red color represented infertile females without intrauterine lesion, the green color represented patients with mild IUA, the purple color represented patients with moderate IUA, and the yellow color represented patients with moderate IUA. (A) The endometrial microbiota was significantly different between patients with IUA and infertile females without intrauterine lesion (P=0.048). (B) The endometrial microbiota showed difference between patients with mild IUA and infertile females without intrauterine lesion (P=0.022).

