
Figure 4.
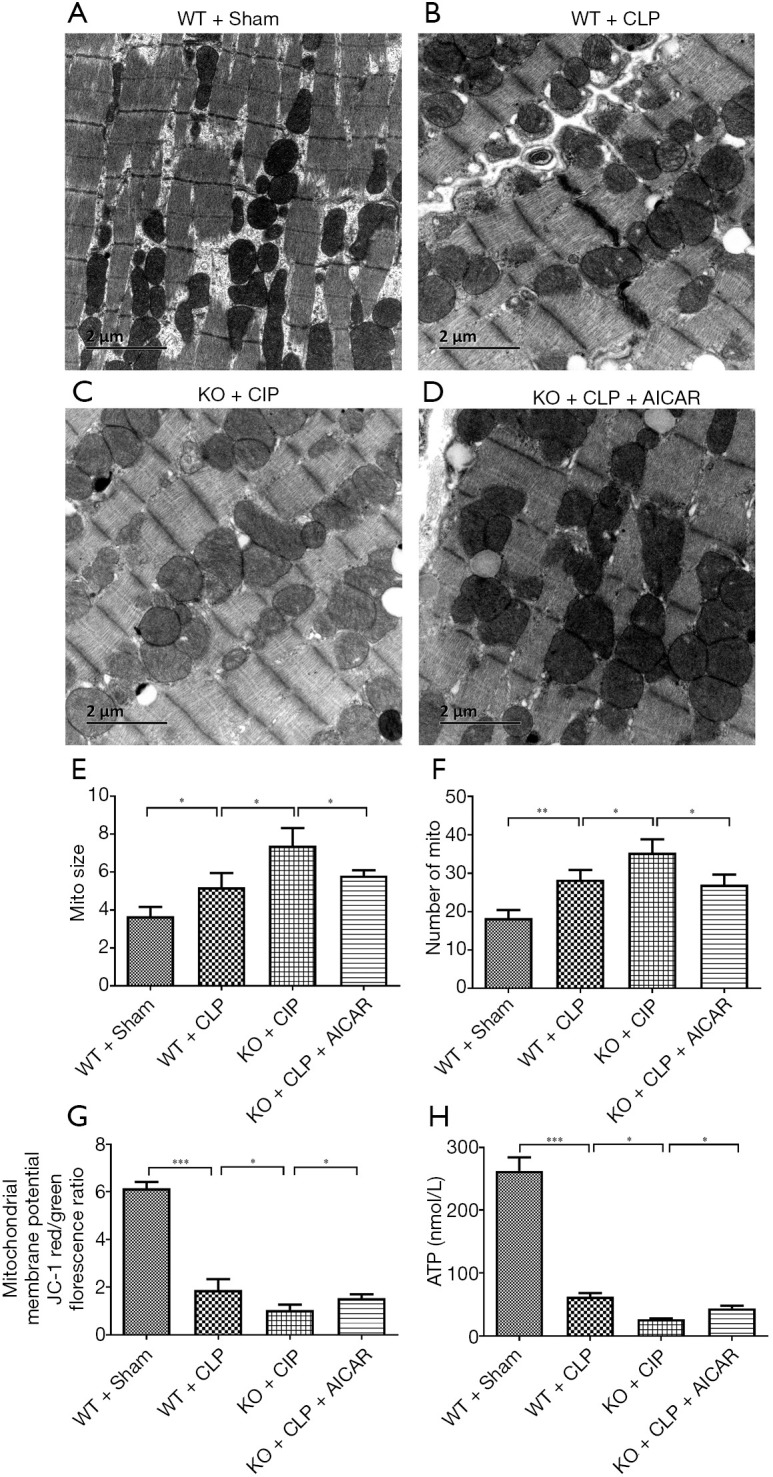
Mitochondrial injury in heart tissue. (A,B,C,D) Transmission electron microscopy observation of heart tissues (×200); (E,F) analysis of mitochondrial size and number; (G) effect on the mitochondrial membrane potential in mouse heart tissue; (H) effect on ATP synthesis in mouse heart tissue. *P<0.05; **P<0.01; ***P<0.001.