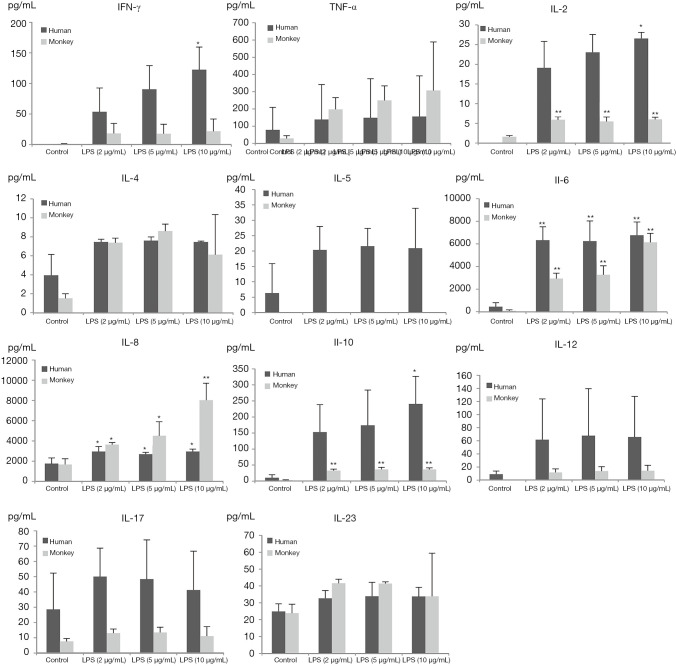
Figure 3.
Cytokine profiles of human and monkey PBMCs treated with LPS or control (n=3). Data are presented as the mean ± SD. Statistically significant differences compared with values of control group are highlighted by asterisks (*, P<0.05, **, P<0.01). PBMC, peripheral blood mononuclear cells; LPS, lipopolysaccharide; SD, standard deviation.

