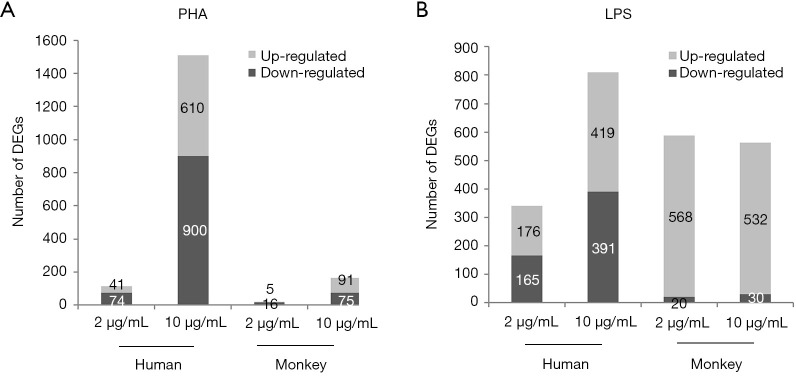
Figure 4.
Up- and down-regulated genes in human and cynomolgus PBMCs treated with PHA (2 or 10 µg/mL) or LPS (2 or 10 µg/mL) compared to control. Bar charts in gray and dark represent the number of up- and downregulated genes, respectively. PBMC, peripheral blood mononuclear cells; PHA, phytohemagglutinin; LPS, lipopolysaccharide.

