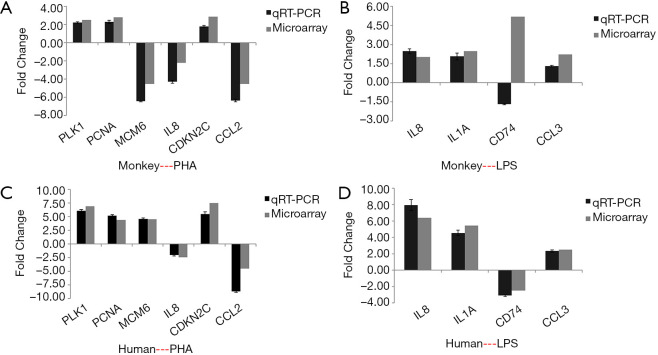
Figure 6.
Effects of PHA and LPS on select gene expression in PBMCs. Impact of 10 µg/mL of PHA on the expression of PLK1, PCNA, MCM6, IL8, CDKN2C, and CCL2, and that of 10 µg/mL of LPS on IL-8, IL-1A, CD74, and CCL3, were validated by qRT-PCR. Fold-changes in expression levels between the PHA group and control are indicated in A (monkey) and B (human). Fold-changes in the expression levels between the LPS and control groups are indicated in C (monkey) and D (human). The qRT-PCR data are presented as means ± SD of three independent samples. Array data were calculated using SAM software. PHA, phytohemagglutinin; LPS, lipopolysaccharide; qRT-PCR, quantitative reverse transcription polymerase chain reaction; SD, standard deviation; SAM, significance analysis of microarray.

