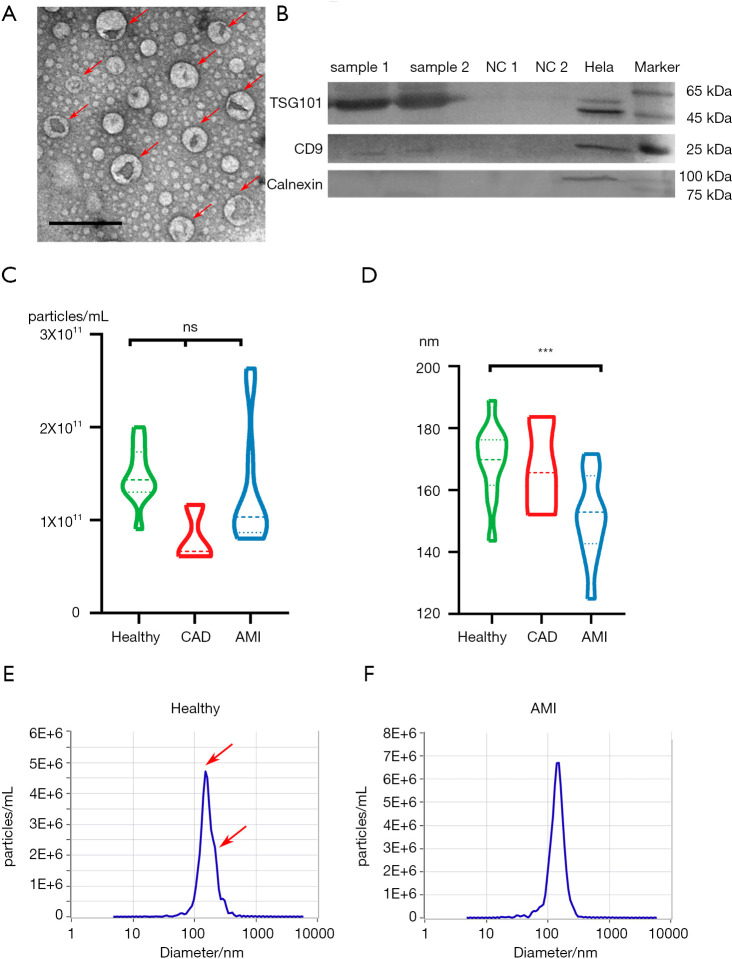
Figure 1.
Characterization of plasma exosomes. (A) TEM of exosomes isolated from plasma revealing the typical exosome morphology and size (50–200 nm). Scale bar =200 nm. (B) Western blot analysis showing the presence of TSG101 and CD9 and the absence of calnexin in plasma-derived exosomes. Samples 1 and 2 represent exosomes isolated from the plasma of randomly selected subjects. NC1 and NC2 are bovine serum albumin (BSA) proteins used as a negative control for Western blot analysis. Hela indicates hela cell lysates. (C) Violin plot of the nanoparticle concentration distribution in the healthy, CAD, and AMI groups. The nanoparticle concentration of the three groups is similar, showing no significant difference. ns, P>0.05; ***, P<0.01, one-way ANOVA. (D) Distribution of nanoparticle diameter in the healthy, CAD, and AMI groups. The nanoparticle diameter of the healthy individuals is about 19 nm larger than that of the AMI group, with significant difference. (E) Nanoparticle diameter and concentration distribution from one healthy plasma sample. There are two peaks of nanoparticle diameter, namely, at about 140 and 165 nm. (F) Nanoparticle diameter and concentration distribution from one AMI group plasma sample. There is only one peak for nanoparticle diameter, which is about 145.8 nm. CAD, coronary artery disease; AMI, acute myocardial infarction; TEM, transmission of electron microscopy.

