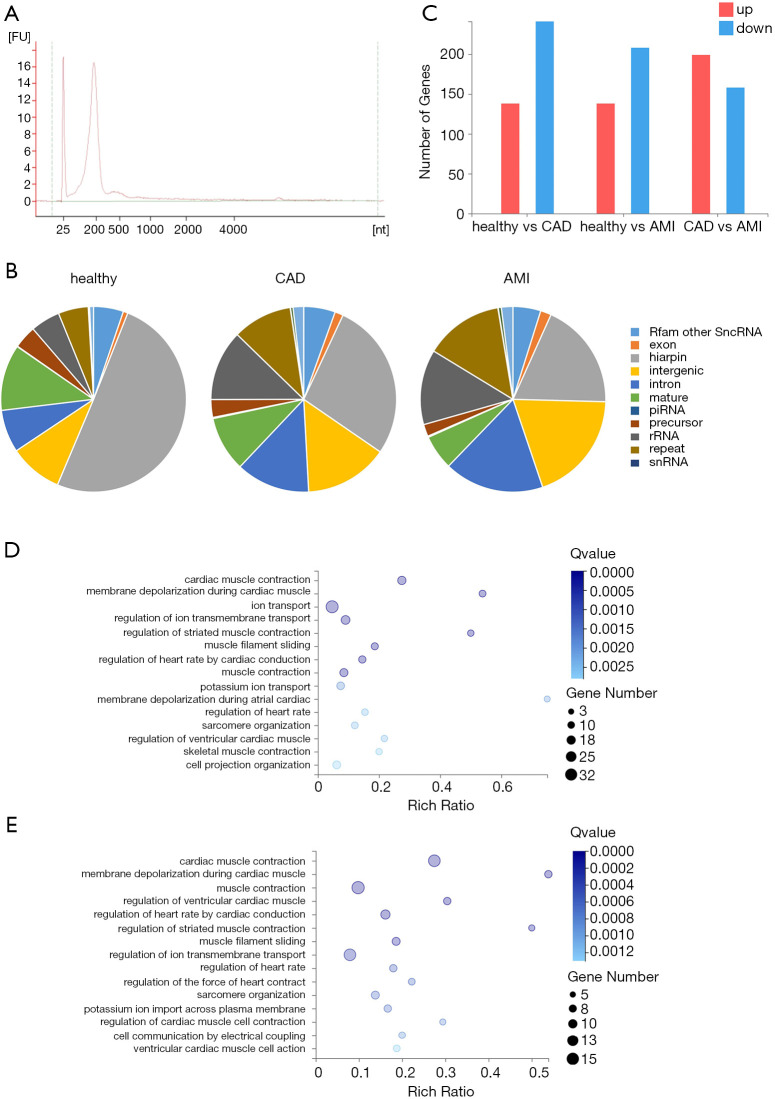
Figure 2.
Distribution and comparison of exosomal RNA in the healthy, CAD, and AMI groups. (A) Electropherogram of exosomal RNA from one AMI patient. Most of the RNA is small RNA <500 nt. (B) Proportion of miRNAs and other types of small RNAs in the healthy, CAD, and AMI groups. (C) Number of differentially expressed genes between the healthy and CAD groups, healthy and AMI groups, and the CAD and AMI groups. The red color bar represents upregulated genes, and the blue color bar indicates downregulated genes. Threshold for upregulated and downregulated genes, |Log 2(fold-change)| ≥1, Q value ≤0.001. (D) and (E) GO bubble graph of developmental processes of mRNAs targeted by differentially expressed miRNAs between the healthy and AMI group (D) and between the healthy and CAD groups (E). Rich ratio = Term Candidate Gene Num/Term Gene Num. CAD, coronary artery disease; AMI, acute myocardial infarction.

