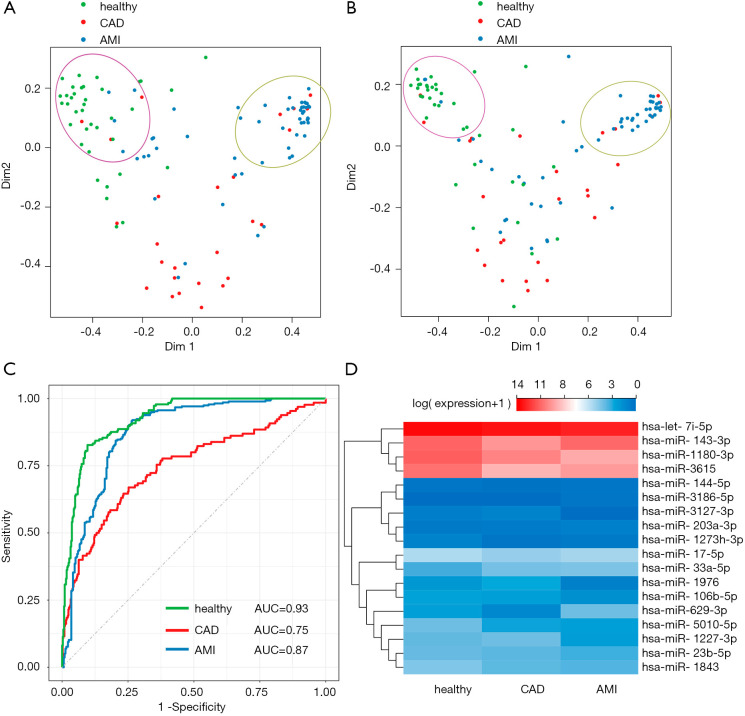
Figure 3.
RF classification and characterization of the predicted miRNA biomakers. (A) MDS plot of samples. Color of dots represent the classification results of the random forest classifier based on all 392 miRNAs. Green dots represent healthy individuals, red dots indicate CAD patients, and blue dots are the AMI patients. The green dots and blue dots cluster well, but the red dots cannot cluster properly. (B) MDS plot of samples. Dot color represents the classification results of the random forest classifier based on all 41 selected miRNAs. Green dots represent healthy individuals, red dots represent CAD patients, and blue dots represent AMI patients. (C) ROC curve assay of the selected 18 exosomal miRNAs as biomarkers. The AUC value of the healthy group was 0.93, the AUC value of the CAD group was 0.75, and the AUC value of the AMI group was 0.87. (D) Expression heatmap showing the relative abundance of 18 selected miRNAs in healthy, CAD, and AMI groups. The relative expression levels are presented by the mean-centered and normalized log-expression values. CAD, coronary artery disease; AMI, acute myocardial infarction; MDS, multidimensional scaling; ROC, receiver operating characteristic.

