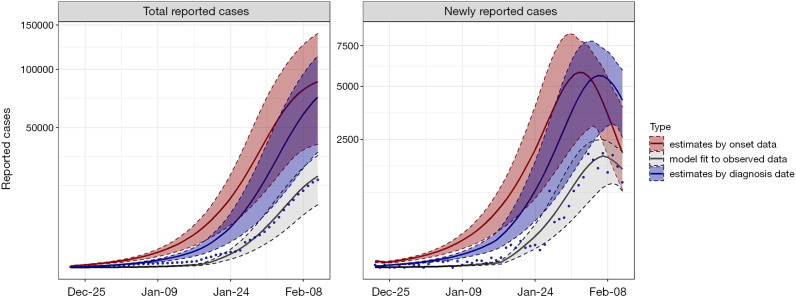
Figure 1.
Plots of the observed data and model estimates for (I) the cumulative numbers and (II) the daily numbers of SARS-CoV-2 infection in Wuhan, December 22, 2019–February 11, 2020. Each panel contains the observed data of actual reported numbers (blue dots), the fitted line (gray line), the model estimates by onset date (red line) and by diagnosis date (blue line) with 95% confidence intervals (bars in the same color).

