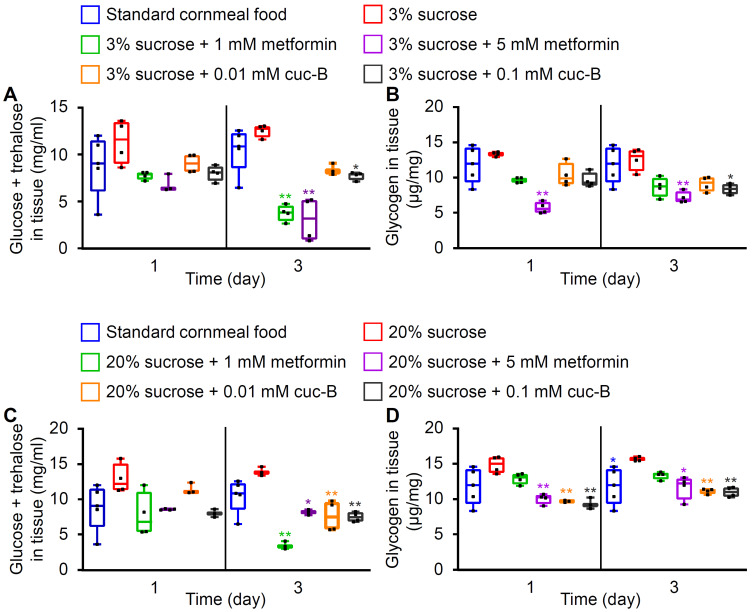
Fig. 3. Measurement of tissue sugar levels.
(A and B) Comparison of sugar and glycogen levels in tissue after feeding a low sugar diet (LSD: 3% sucrose). (A) Glucose and trehalose levels in tissue and (B) glycogen levels in tissues of control flies after being fed with standard cornmeal, LSD, or LSD combined with the indicated chemicals (n = 4). (C and D) Comparison between sugar and glycogen levels in fly tissue after being fed with a high sugar diet (HSD: 20% sucrose). (C) Glucose and trehalose levels in tissue and (D) glycogen levels in tissues of control flies after being fed with standard cornmeal, HSD, or HSD combined with the indicated chemicals (n = 4). All error bars indicate the maximum or minimum values. Single-factor ANOVA coupled with Scheffe’s post hoc test was conducted to compare multiple datasets. Asterisks indicate significant differences (*P < 0.05, **P < 0.01) between (A and B) LSD or (C and D) HSD feeding.

