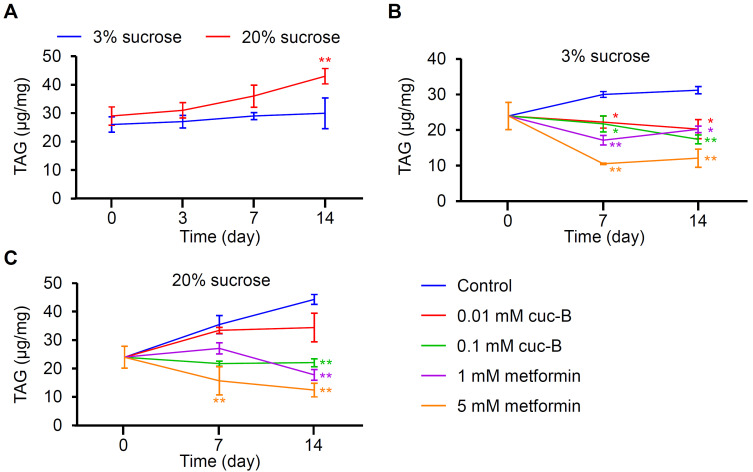
Fig. 4. Lipid (TAG) level measurement in control male flies.
(A) TAG level measurement at indicated time points after LSD or HSD administration (n = 4). (B) TAG level measurement at 0, 7, and 14 days after LSD administration with or without the indicated chemical (n = 4-5). (C) TAG level measurement at 0, 7, and 14 days after HSD administration with or without the indicated chemical (n = 4-5). All error bars indicate the SEM. (A) Asterisks indicate statistical significance (**P < 0.01), as determined by Student’s t-test comparisons between LSD and HSD. (B and C) Single-factor ANOVA coupled with Scheffe’s post hoc test was conducted to compare multiple datasets (*P < 0.05, **P < 0.01).

